Visualizing data for nonprofits: How to captivate your audience with data design
I’m Nat, a graphic designer here at Sweet Grass. I didn’t initially go to school for design — in college, I majored in cognitive science, which is all about how people think and process information. Since cognitive science is a social science field, statistics featured prominently in my studies. I’m lucky to have a basic foundation both in statistics and in how people make sense of them, which is incredibly useful when designing with data.
Here’s the thing about the human brain: it tends to be really bad at understanding numbers. Put a bunch of numbers next to each other in a list, and most people will get stuck staring at an overwhelming mass of digits. They won’t be able to picture what those numbers mean or get an intuitive understanding of how they relate to one another. Conversely, the human brain tends to be really great at interpreting pictures — after all, vision is the primary sense through which most people experience the world, and we have to be good at turning all that visual information into something that makes sense.
That’s where data visualization comes in. At its core, data visualization is using images to show how numbers relate to each other so that we can make sense of them on a more intuitive level. Common examples include charts, graphs, maps, and pictorial infographics.
When you have a bunch of numbers that need to tell a story — for example, demographic data about your community, how much money your donors have raised, or how many community members your nonprofit has served — data visualization becomes crucial. It’s one thing to say “we served 91 clients in 2023, 145 clients in 2024, and 274 clients in 2025,” but another thing to show it.
Choosing the right approach
The first thing I do when starting a data visualization project is look at the types of data I need to illustrate and the medium that we’re using to share it. From there, I can figure out what kind of visualizations make the most sense. I commonly ask myself questions like:
What core information needs to be communicated?
Are we looking at proportions (pie and stacked bar charts), changes over time (line graphs and bar charts), differences across geography (maps), or differences across categories (bar and pie charts)?
How will we be sharing this — a letter-size report, a wide horizontal presentation, a square social media image, or a scrolling web page? Will it need to be adapted for multiple formats?
What type of layout works best with both the information I need to share and how we’ll be sharing it?
Once I figure out the general format I’ll be using, I do most of my data visualization work in Adobe Illustrator, which has some simple graphing tools. If the data visualization is more complex than can be easily graphed in Illustrator, I’ll start in a program like Excel, then move the graph over to Illustrator once I’m ready to refine the design.
One of the big challenges of visualizing data is balancing what looks good with what’s accurate and informative. If you go too wild on the art side, it can distract from the information you’re trying to convey. Trying to cram too much information into one graphic can be confusing and overwhelming for the audience. And you have to be careful not to distort the statistics or portray them in a misleading way.
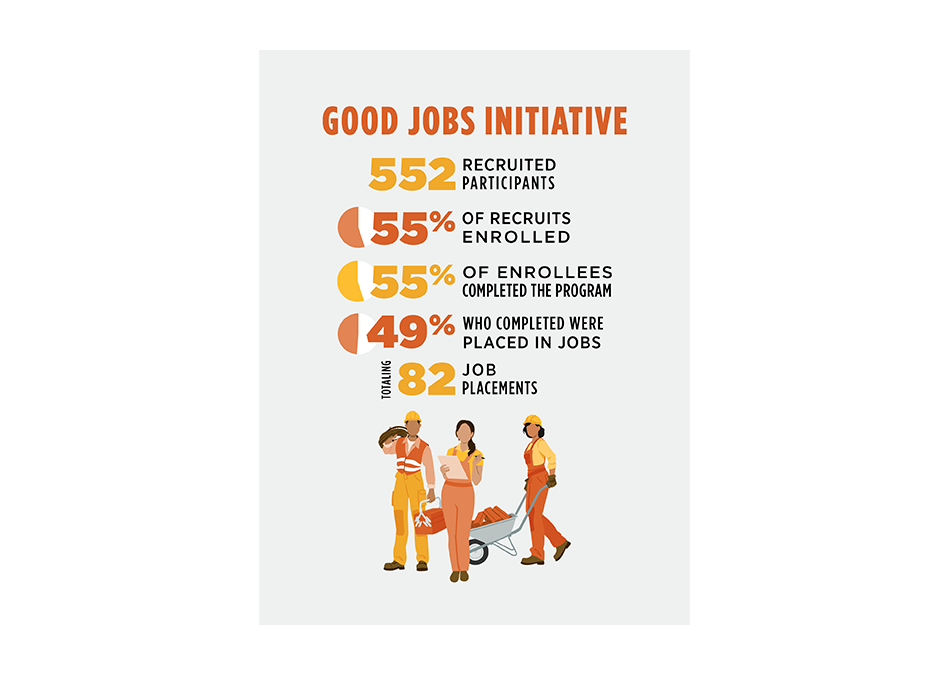
Even choosing the correct visualization for the data can be challenging. There are many different ways to communicate the same data, and different choices communicate different stories. The example below is the original version of a recent infographic I designed for the South Dakota Native Homeownership Coalition (SDNHOC). The focus was on the total numbers to convey a story about how many people the Good Jobs Initiative helped.
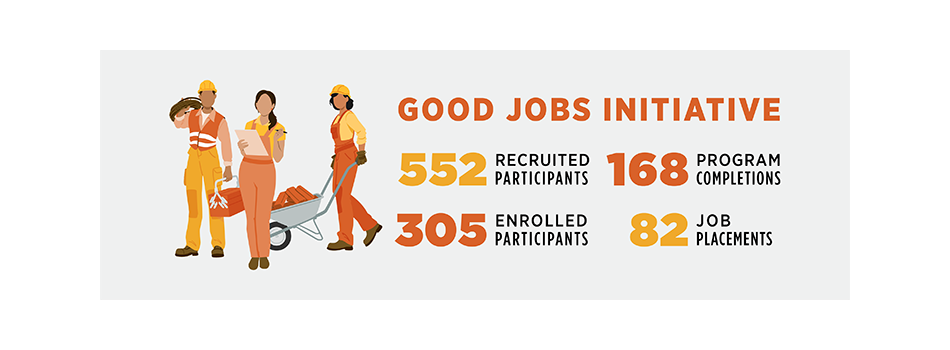
However, for a later presentation, the folks at SDNHOC needed to communicate the efficacy of the program — the proportion of participants who achieved certain outcomes. I ended up redesigning this graphic to incorporate small pie charts in order to switch the story from the volume of participants to the success rates of participants. I had to change the layout pretty significantly to fit the updated visuals. Had I begun with the goal of showing success rates, this section might look even more different. I might have incorporated the builder figures more into the graph structure, for example, or used nested charts to visually indicate that each new percentage is a portion of the last percentage.
Designing for advocacy and social justice
When designing for social justice, the core principles of data visualization remain the same, but the strategy will change based on the audience. One of the key questions I ask myself is “who am I designing for?” Are they internal stakeholders? Funders? Prospective clients? Are they staff members of a foundation who look at financial data all day, or are they community members with limited financial vocabulary? The audience affects what information I focus on and how that information is presented.
I also try hard to keep cultural and local context in mind. Not only to stay away from stereotypical or offensive imagery, but also so that I can better connect to the audience. If I’m using images of people, I try to make sure they look like members of the community I’m depicting. If I’m using images of the environment, I try to tailor them to the local landscape.
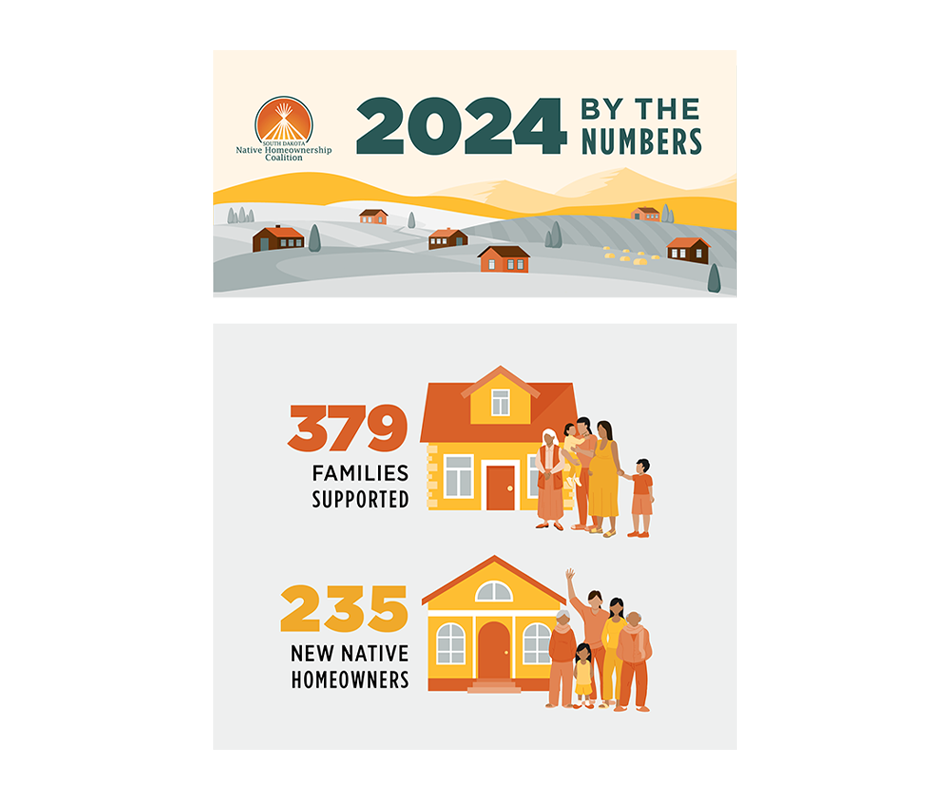
For example, in the SDNHOC infographic, I styled the background with the kind of agricultural, hilly landscape you see across many parts of South Dakota. With the human figures, I was careful to vary skin tone (unlike lots of ready-made stock graphics, which tend to be pretty uniformly pale skinned). When depicting families, I chose to show multigenerational households instead of the Eurocentric ideal of the “nuclear family.”
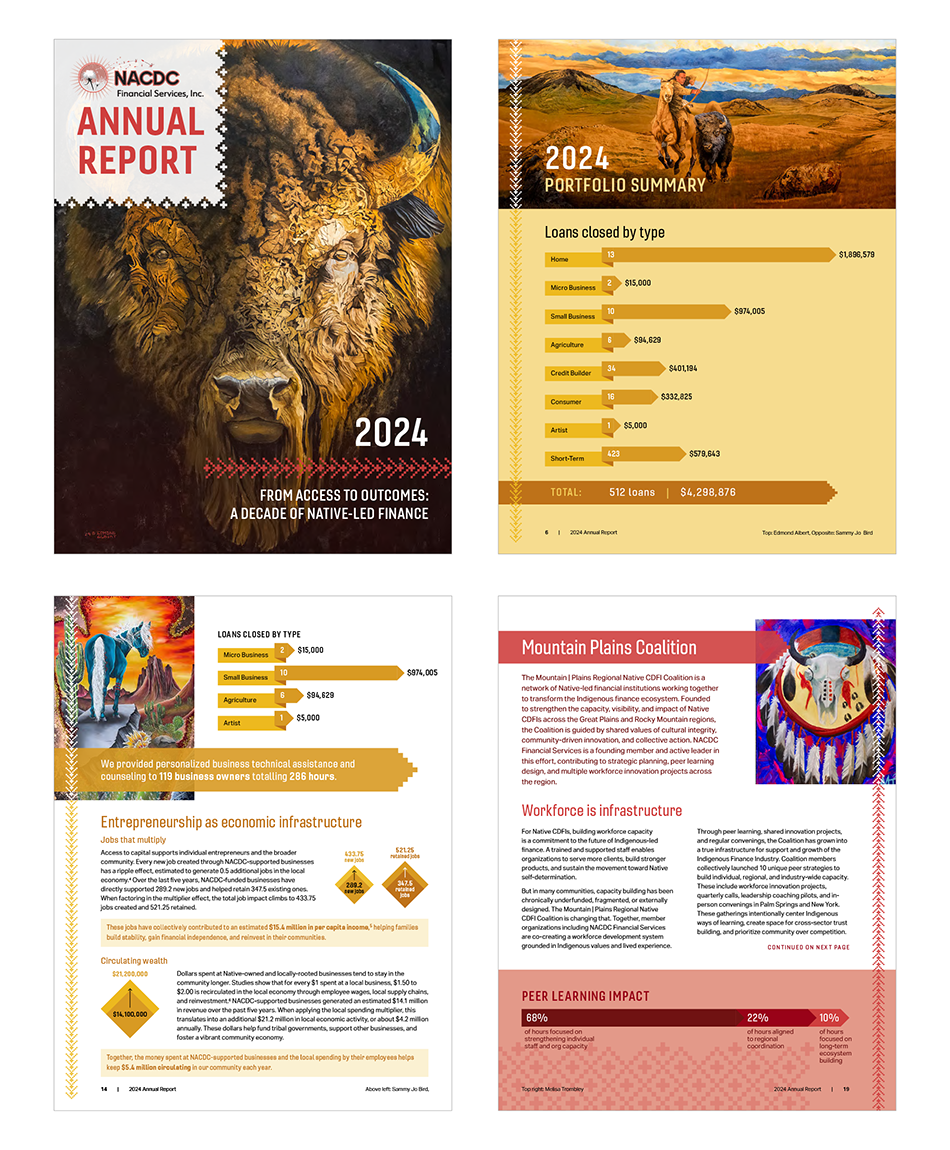
I also like to look at art and design from the community I’m designing for. Specificity is one of the key ways to avoid stereotyping. When doing visual research for a design, instead of searching for “Native American Art” for inspiration, I’ll look for art specifically from the Nation(s) I’m designing for. For example, in the 2024 NACDC Annual Report, I pulled colors from the many artworks featured in the report, and used stepped geometric designs inspired by textiles from several Montana Native Nations.
Getting started with data visualization
Here are a few helpful things to keep in mind when you’re starting out:
Make sure your data is accurate. Look into where it came from and how it was collected. If need be, ask the person who’s giving you the data where they got it. Even the most beautiful visualization loses its value if the data behind it isn’t solid.
Know your audience and the story you want to tell. The same numbers can illustrate different narratives. For example, if you want to emphasize the impact of your existing services, you might call out the large number of people your organization has helped this year. If you want to emphasize the need for further services, you might focus on the difference between that same number of people and the size of the population that you weren’t able to reach.
Start simple. Above all, data visualization should be informative, and too much clutter can make it harder to understand. Figure out the core information you want to communicate, and focus on the most direct way to visually convey that information. Ideally, your visualization should be easy for the intended audience to read and interpret. That might mean going for a few simple pie charts instead of a large, illustrated infographic, and that’s okay!
Additional resources and inspiration
A really decent introduction to the basics of data visualization (with a bit more focus on the statistics side than the design side) is Fundamentals of Data Visualization by Claus O. Wilke, which is entirely free to read online. For design inspiration, Behance and Tableau Public are good places to see cool projects by designers from all over the world.
Share