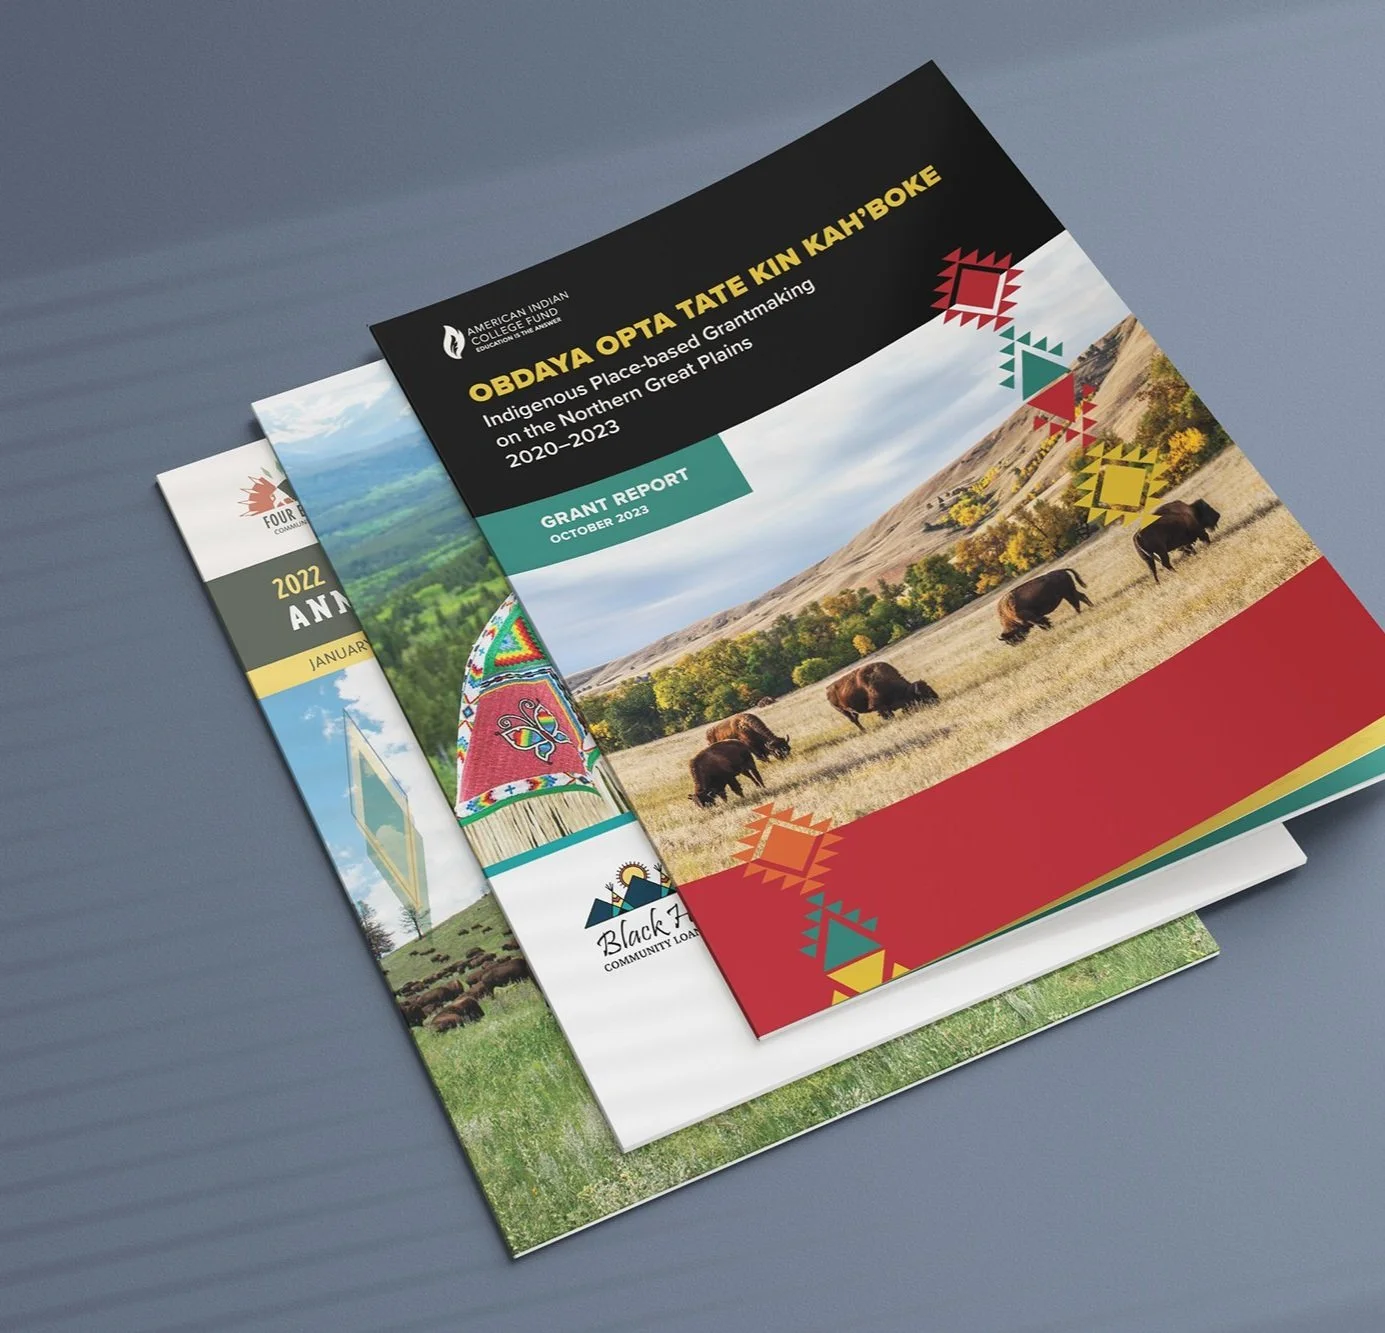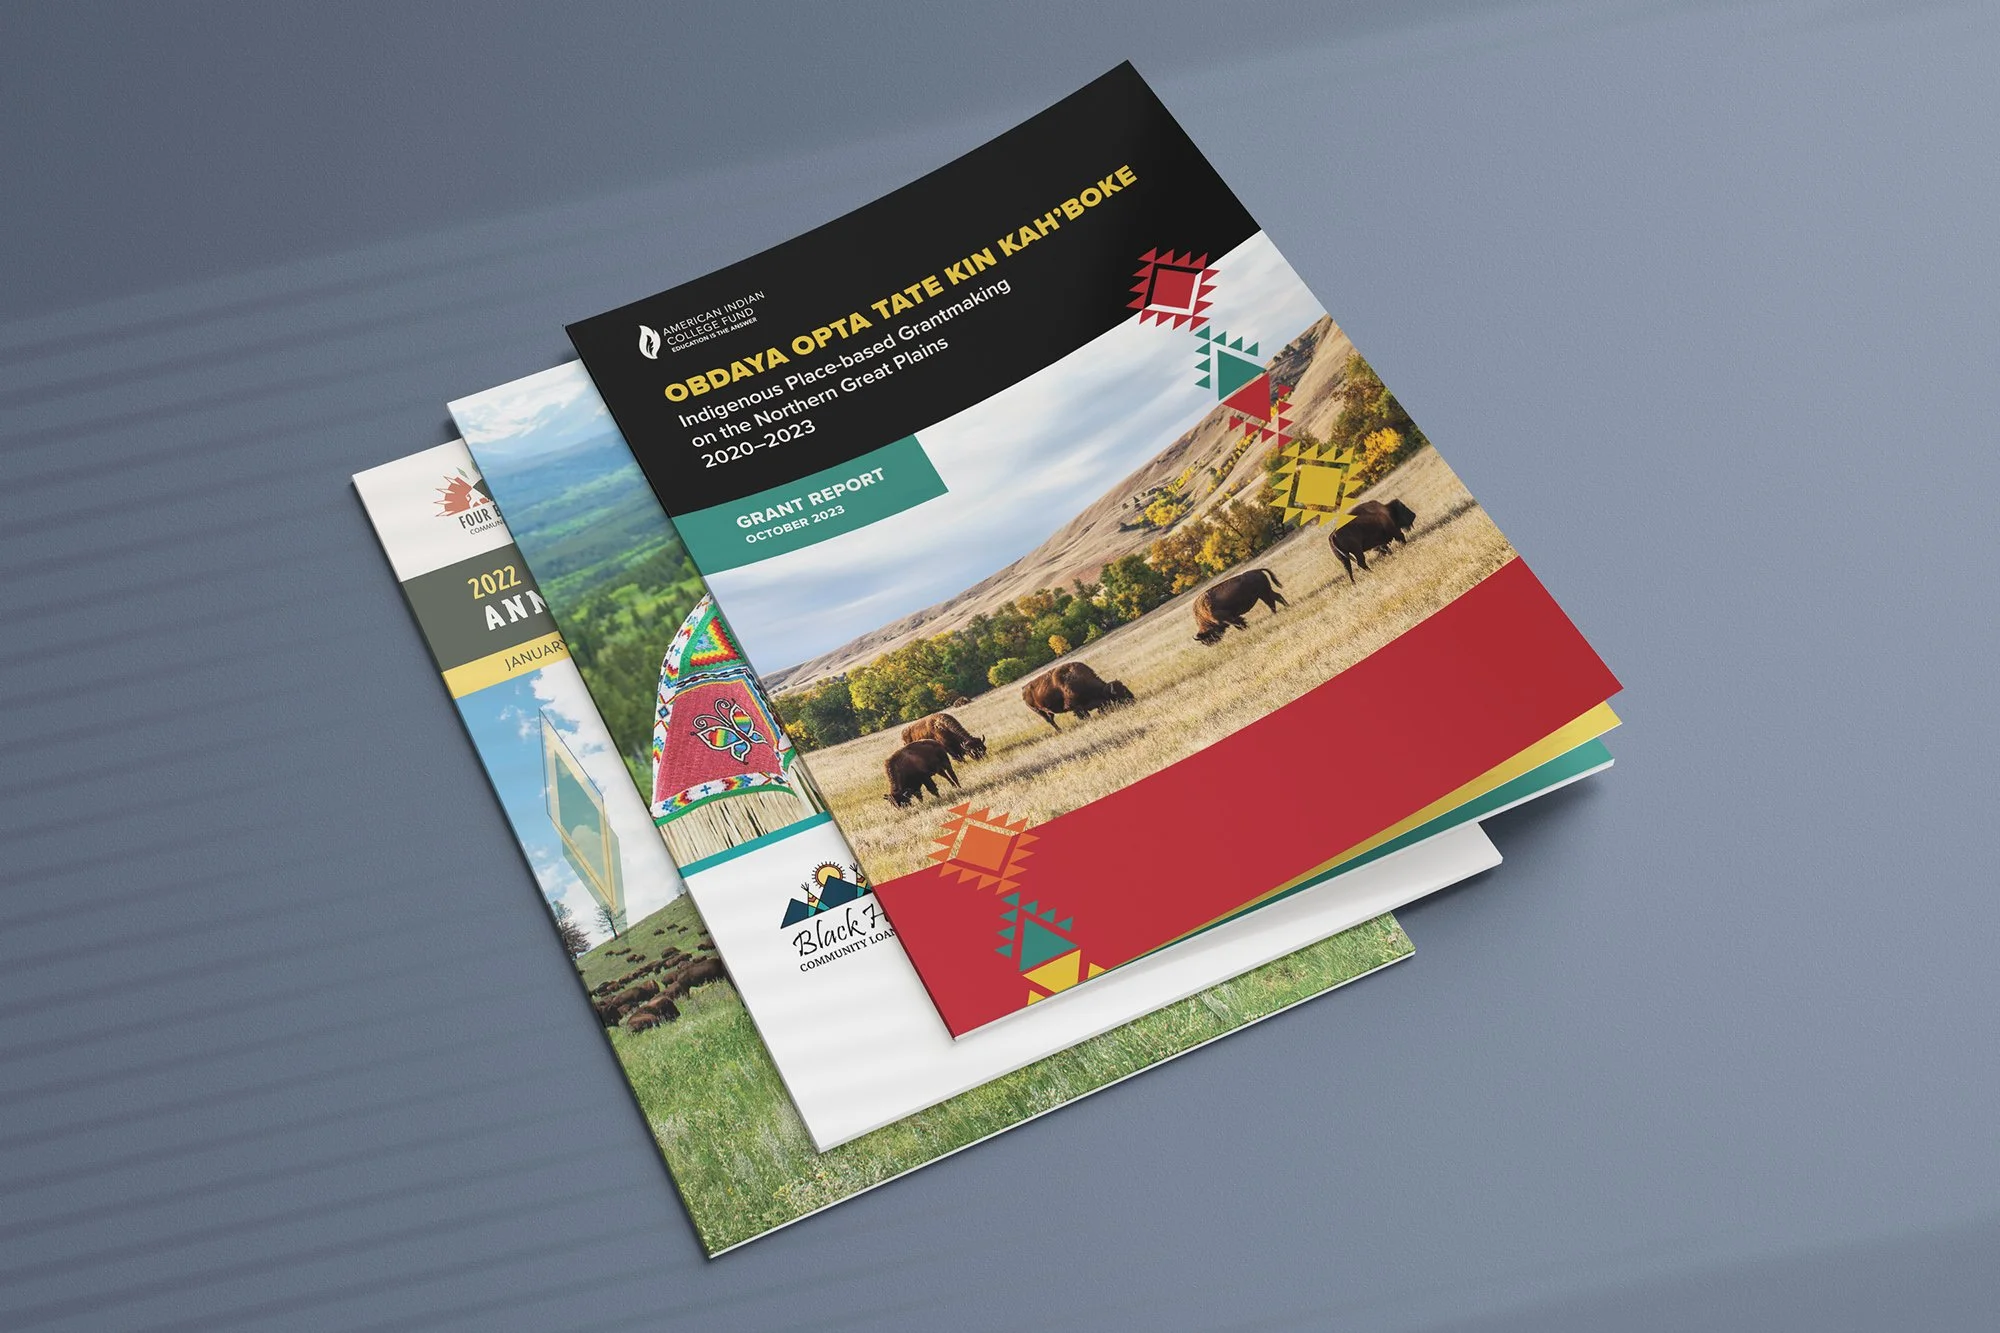
Examples of reports designed by Sweet Grass.
Over the years, I’ve designed lots of annual and impact reports, both here at Sweet Grass and in my prior work as a freelance graphic designer for nonprofits. Before that, I worked in fundraising and development for a small nonprofit. I saw firsthand how much of a difference it makes to use effective materials when presenting your case to donors and other potential funders. It’s much, much easier to ask for funds when you have a neatly packaged way to demonstrate how you use those funds and how they’re making a difference.
Here, I’ll walk through some of the key elements that I’ve found make an annual report effective. For visual references, I’ve included examples from recent reports I designed for NACDC Financial Services and Akiptan. A quick note on terminology: I’ll mostly be referring to annual reports in this post, but the same tips apply when designing impact reports.
Before you begin
Remember your audience
First, establish who the annual report is for and its primary purpose(s). Most annual reports are created first and foremost for current and potential donors or investors who are concerned about how their money is being spent and how it’s making a difference. If you want to use the report for additional purposes, like volunteer or program recruitment, keep your audience in mind.
What to incorporate
The most effective impact reports tend to address the following topics.
Mission and vision: Why does your organization do what it does? What goals are you working toward? (See Figure 1.)
Programs and services: What does your organization do?
Financial information: How much money has your organization received, from which sources, and how was that money used? This is especially important if you plan to use this report with current or future donors. (See Figure 2.)
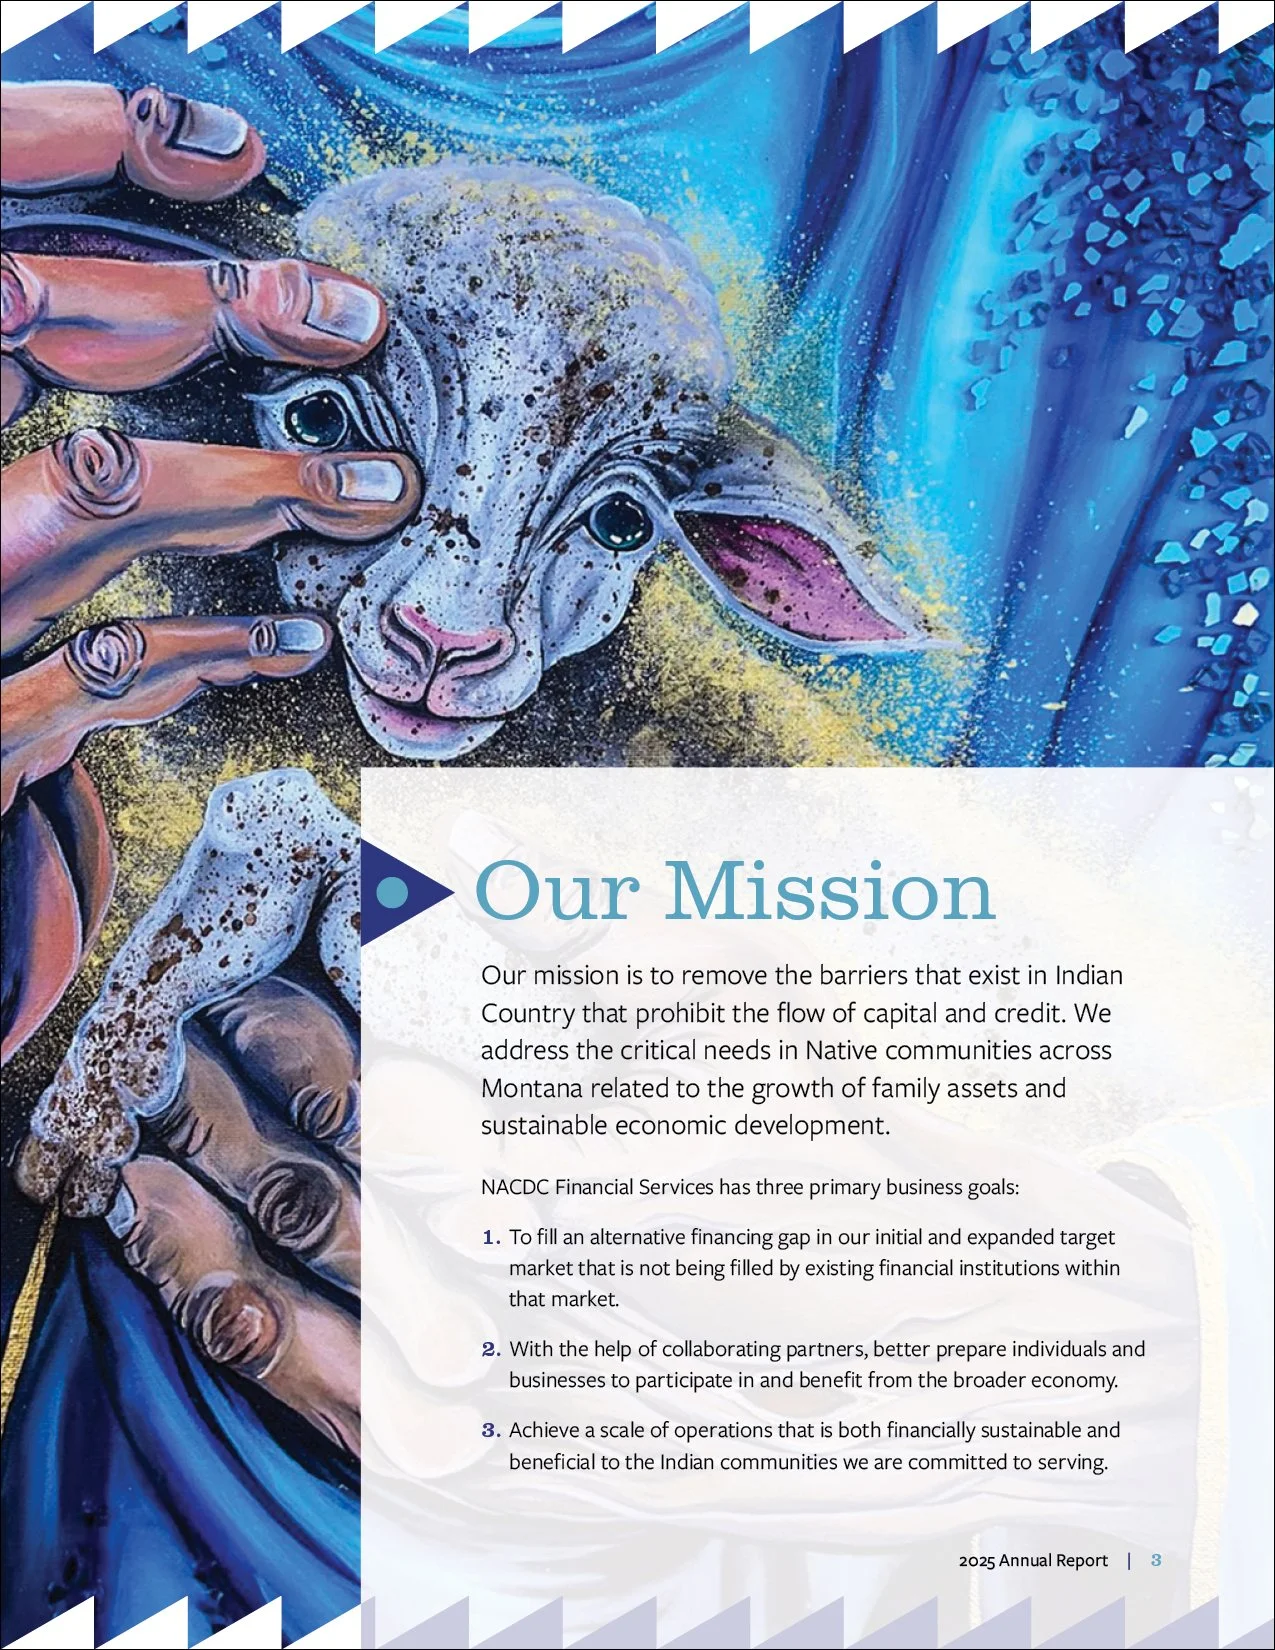
Figure 1
Mission statement
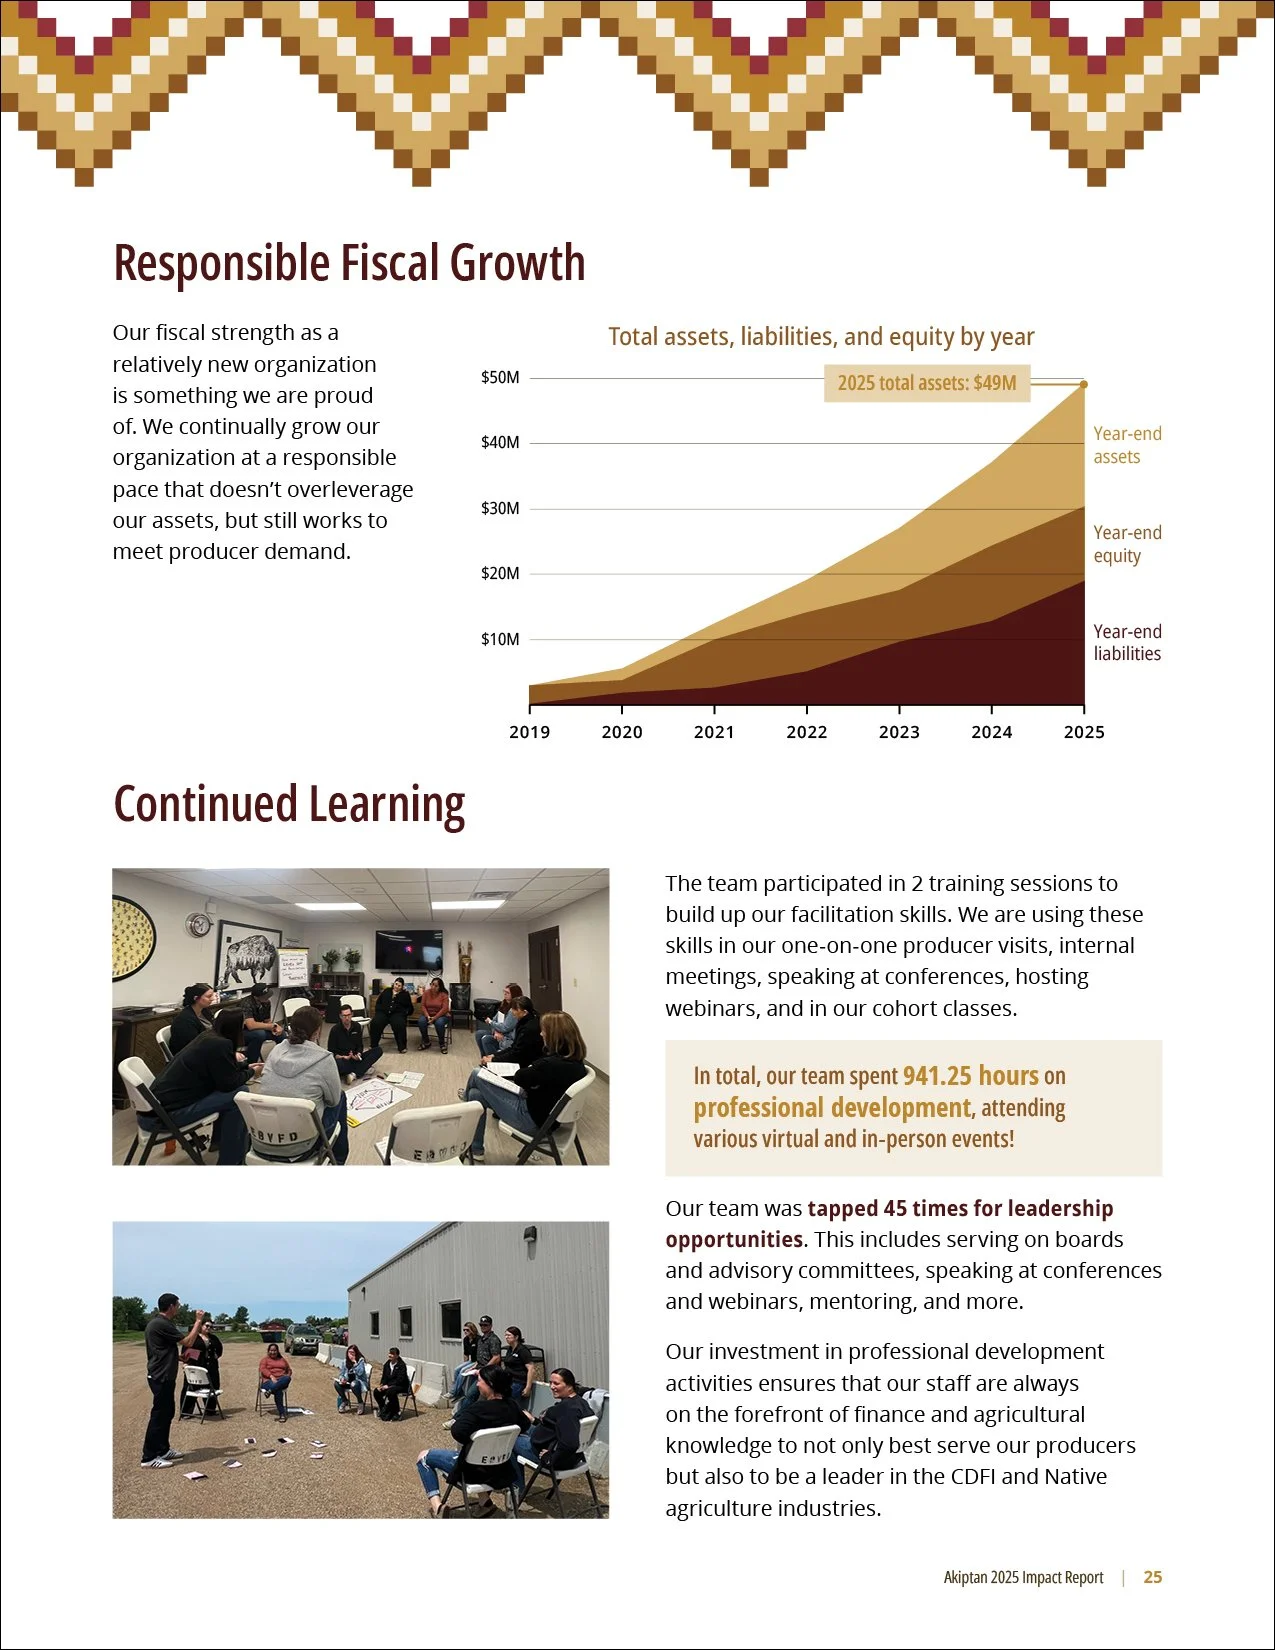
Figure 2
Financial information
Metrics: How can you quantitatively show your organization is necessary and making a difference? This part depends on what kind of data your organization collects. Some possible places to start include:
Service data. This can include the number of individuals your organization reached, hours of programming or number of events, and/or the value of goods or services your organization provided. (See Figure 3.)
Demographic data. What statistics show that your organization is needed? This can involve community data you’ve collected yourself or data collected by other sources like the US Census Bureau. (See Figure 4.)
Evaluation and outcome data. This takes the most planning to implement, and includes things like before/after surveys and program evaluations to show how your services have impacted clients.
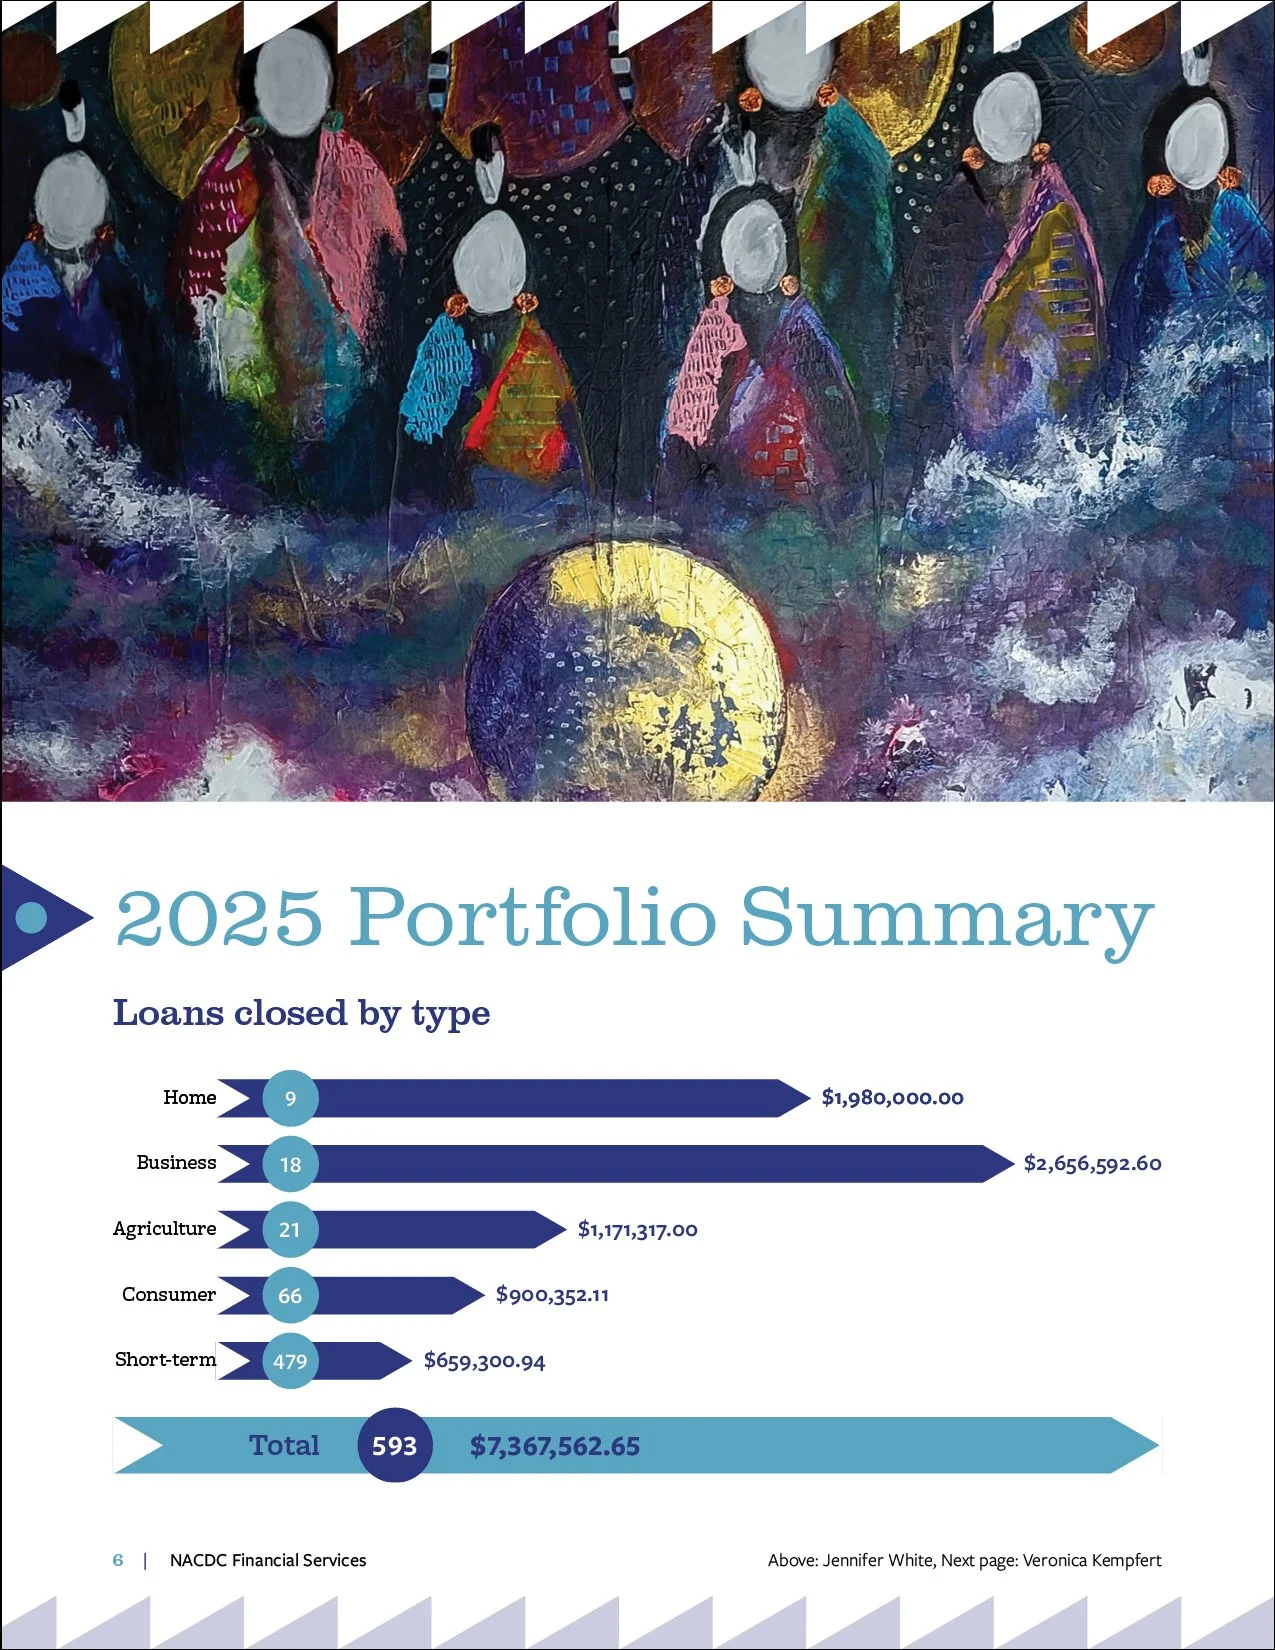
Figure 3
Service data
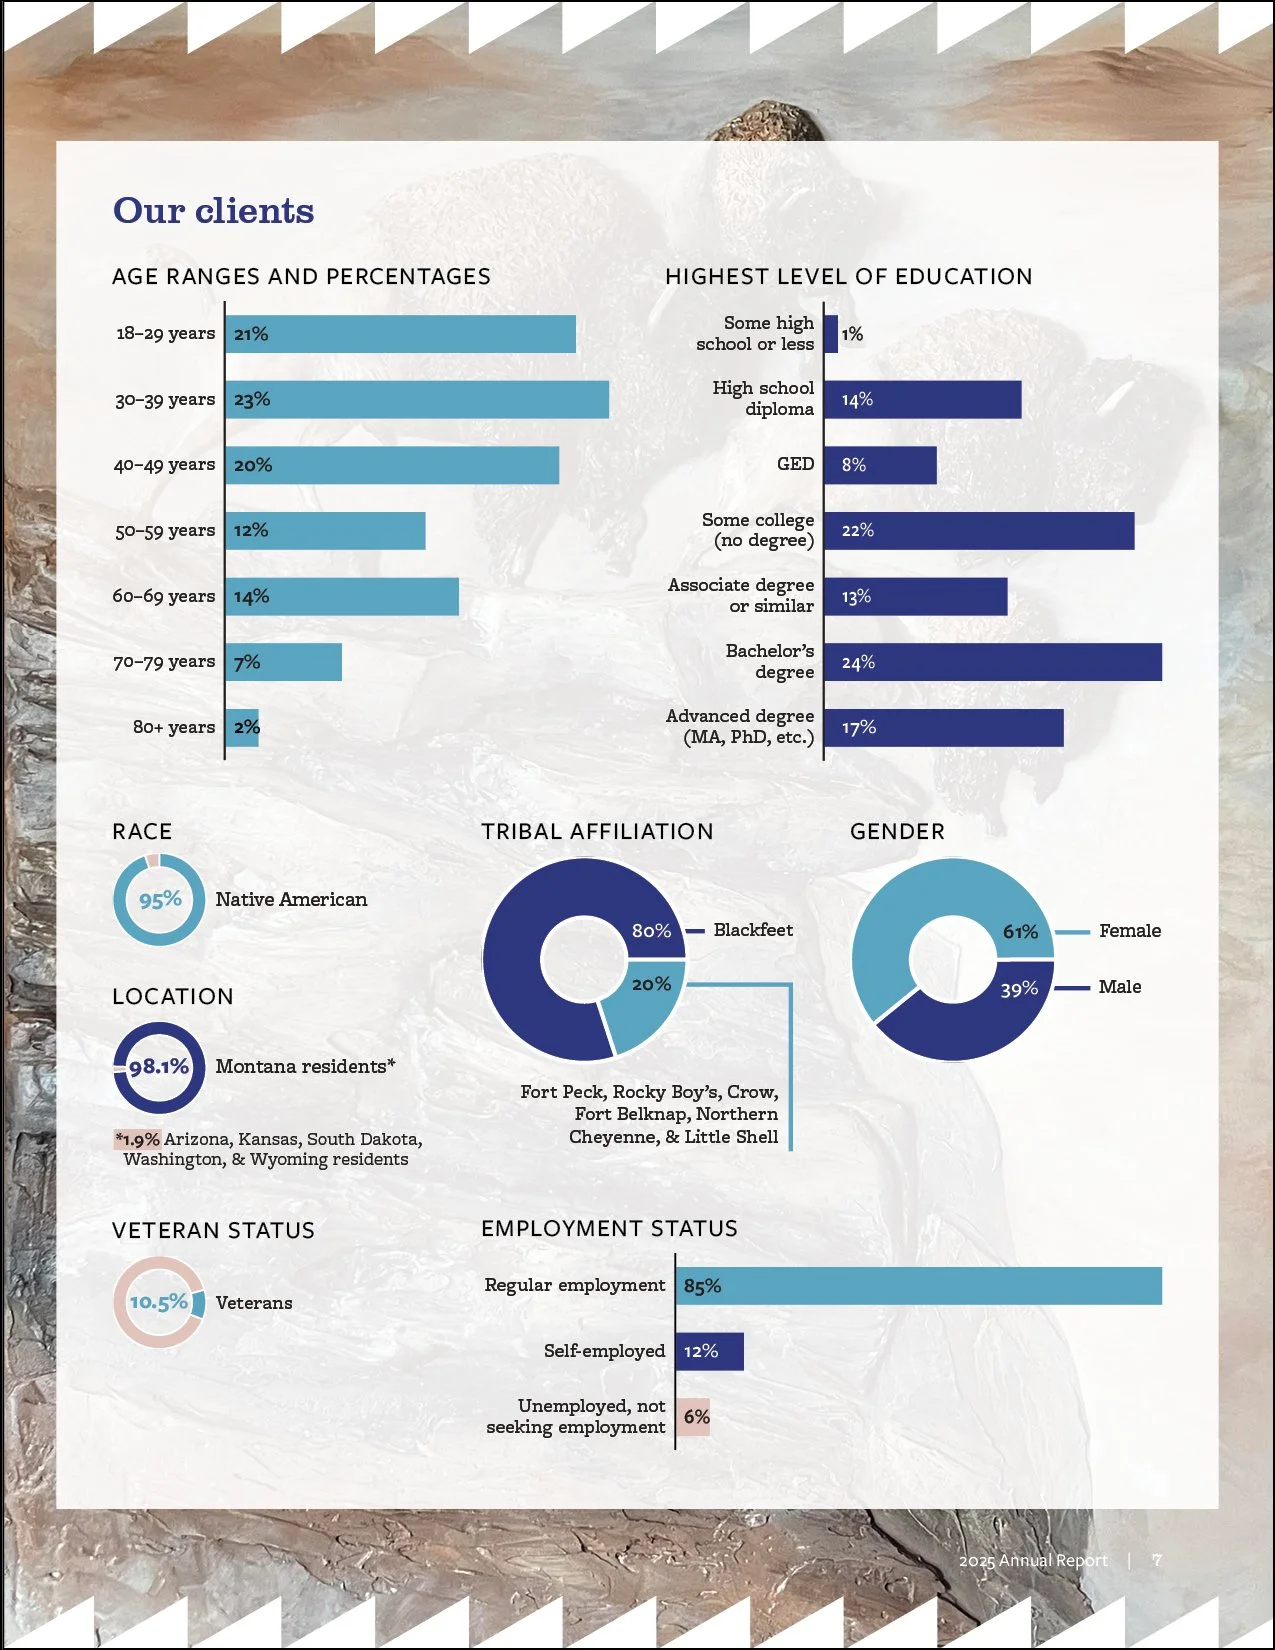
Figure 4
Demographic data
How you’ve grown and changed. How are you doing now compared to last year, or since your organization began? Ideally, compare your current metrics to past metrics, showing how things have changed year-to-year. (See Figure 5.)
Success stories or testimonials. How can you qualitatively show your organization is necessary and making a difference? These can be direct quotes or narrative summaries, but you want to put a face on what you do. People tend to be better at conceptualizing things on an individual level than trying to envision numbers. It’s one thing to say “we provided support to X number of clients” and another to hear how your support changed a client’s life. (See Figure 6.)
Major accomplishments or milestones. What major goals have been accomplished and what events have occurred in the last year? (See Figure 7.)
Key leadership and supporters. Who made your work possible? This usually includes board members, staff, major funders, and partners. (See Figure 8.)
Each of these topics can be addressed in their own sections or be incorporated throughout the report. For example, organizations often use categories of programs and services to break the report into sections, each of which provide related metrics, milestones, and success stories.
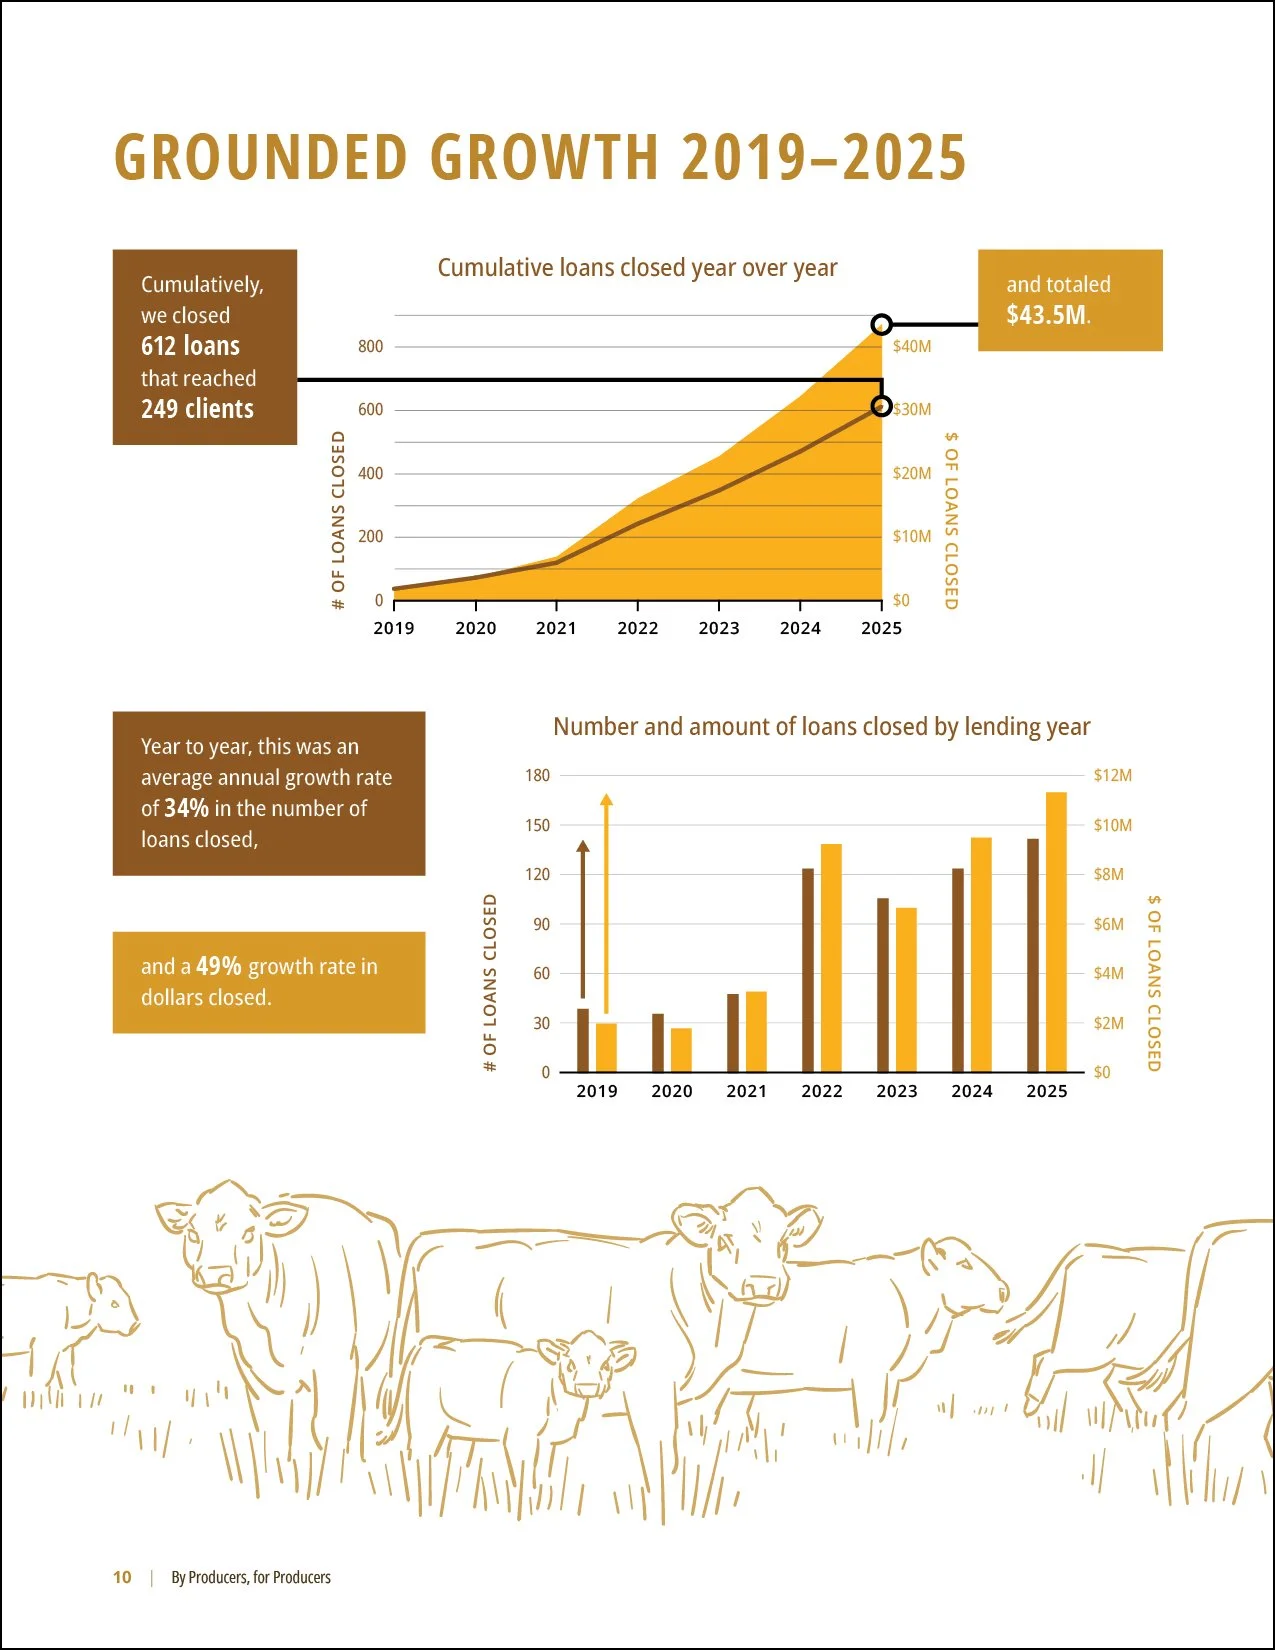
Figure 5
Growth and change
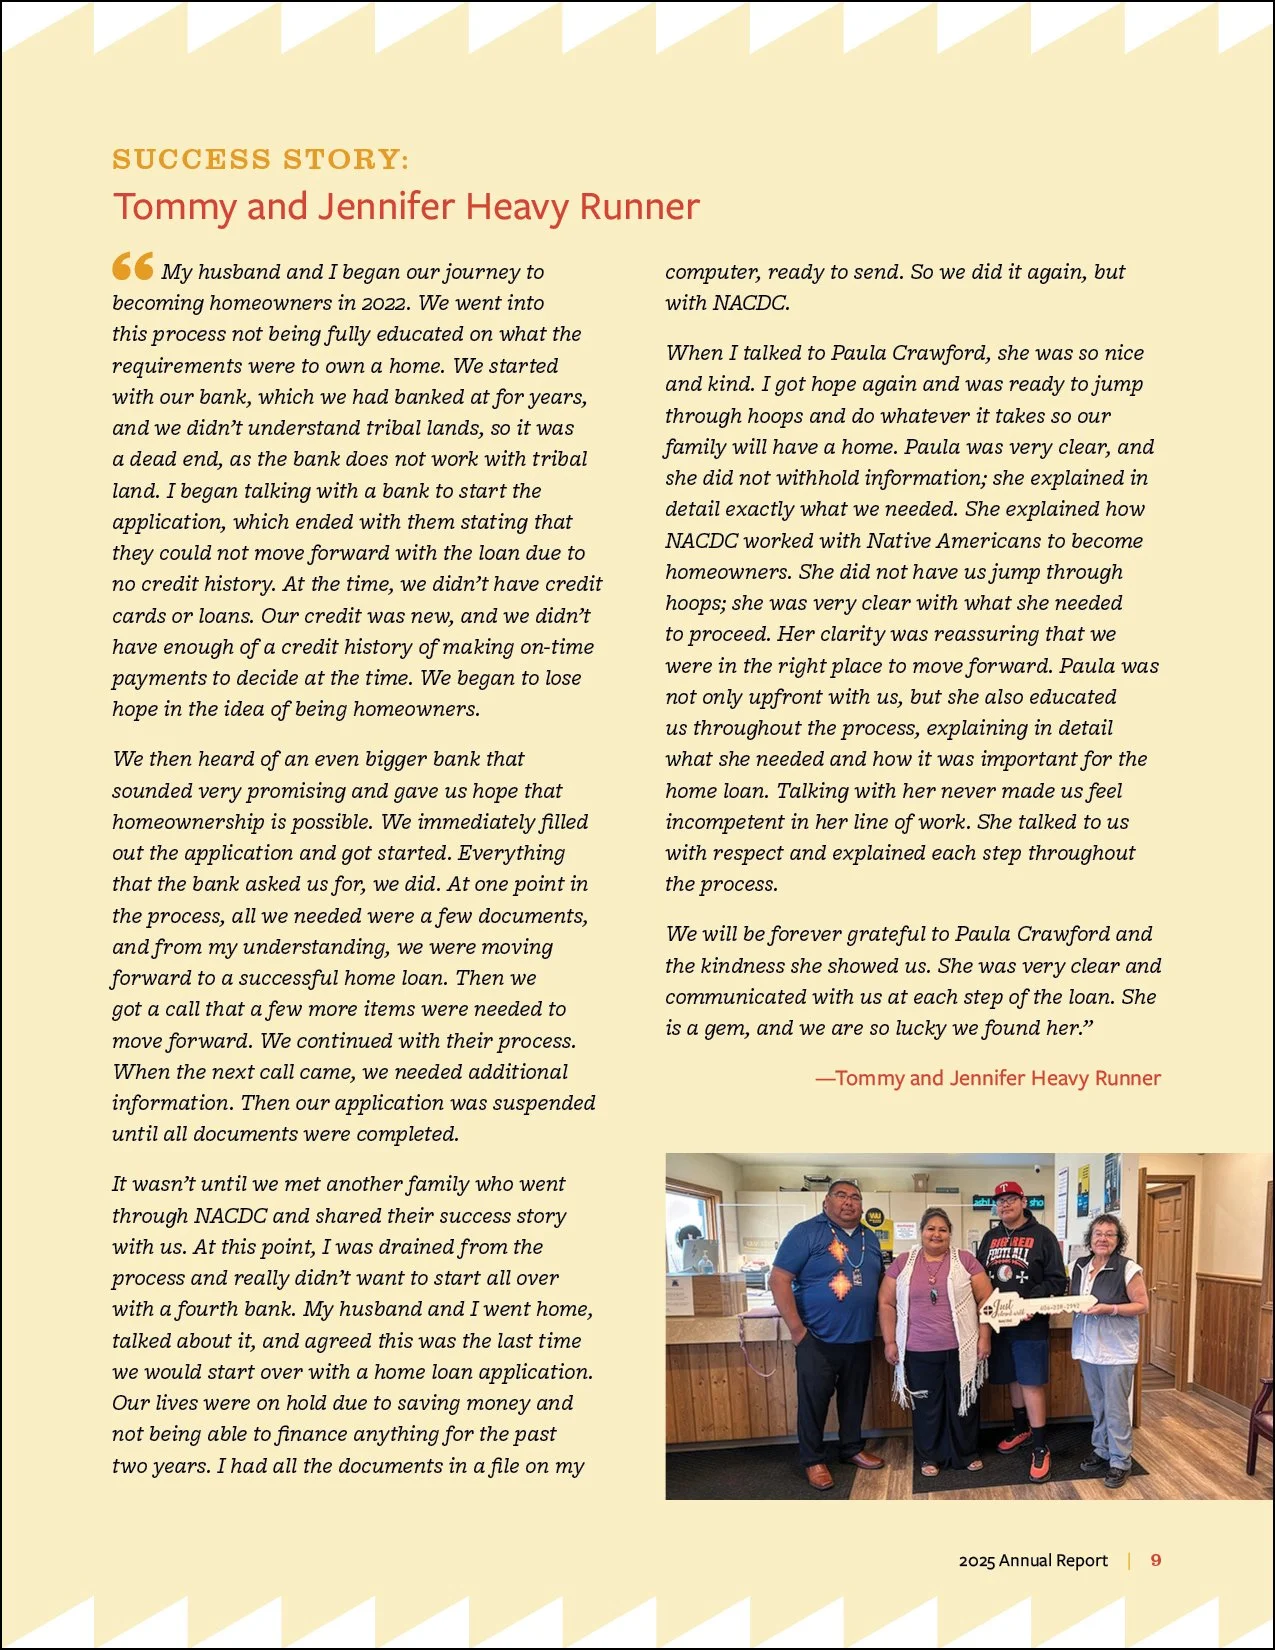
Figure 6
Success stories
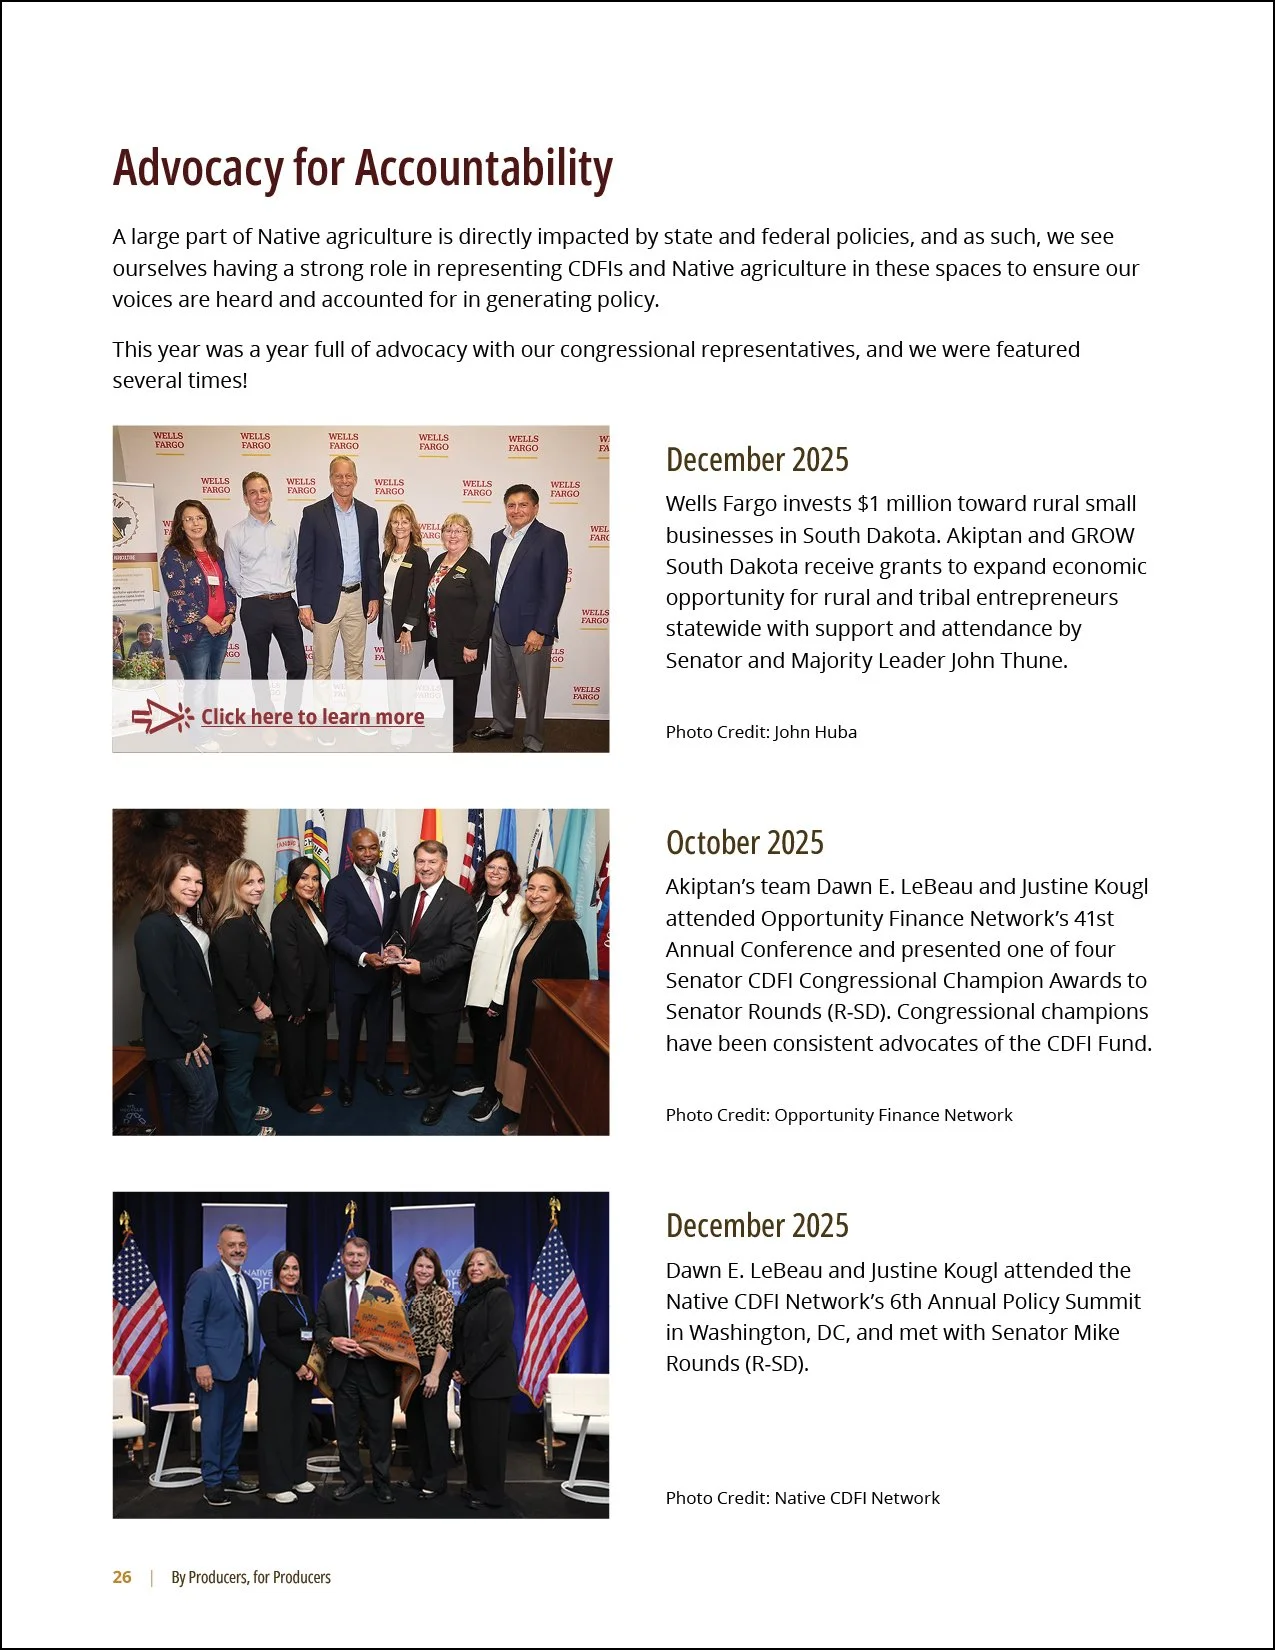
Figure 7
Accomplishments and milestones
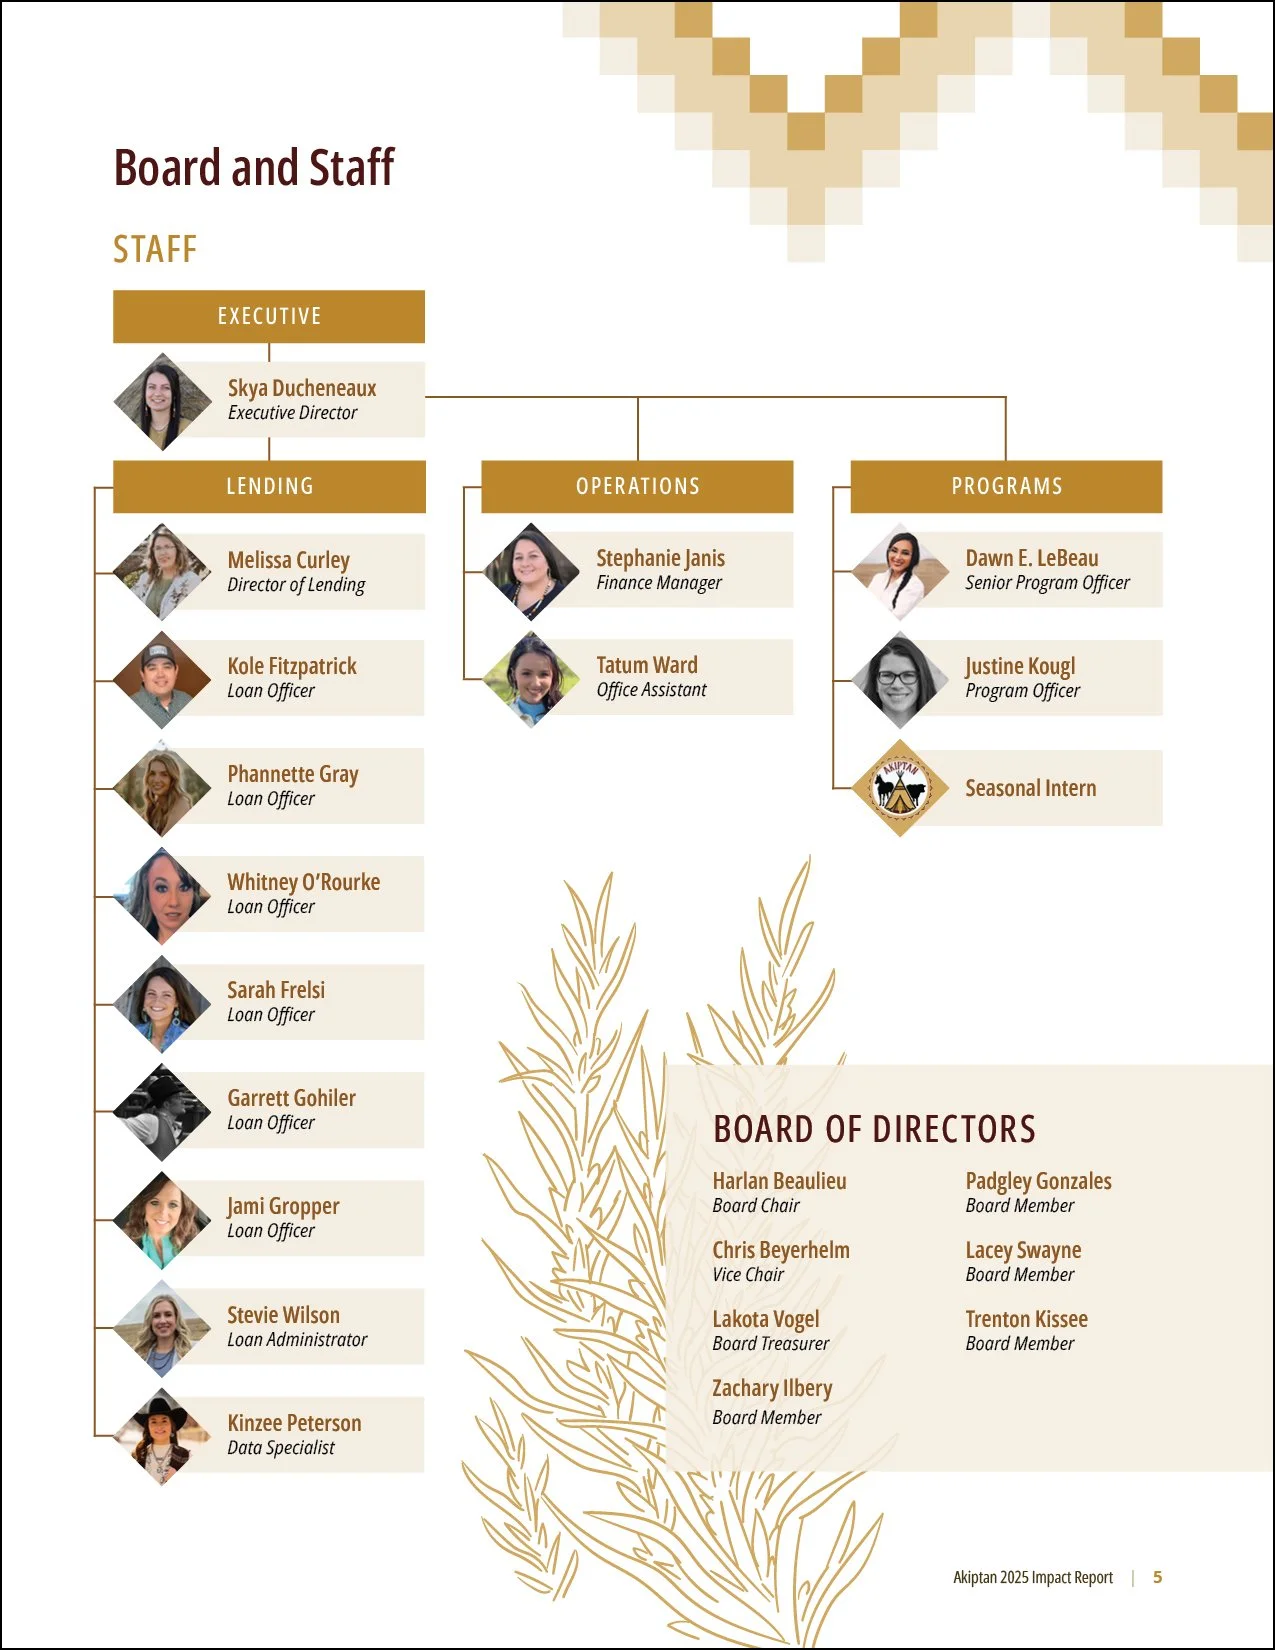
Figure 8
Board and staff
Key visual components of a well-designed report
A report is more than just its text — a thoughtfully and well-designed document can help communicate your message and make the information feel more trustworthy.
Format
Before you start designing the report, think about how it will be distributed. Will it be printed, shared digitally, or both? If it’s going to be printed, make sure you stick to traditional paper sizes, and consider if you’ll be printing in color or black & white. If it's going to be distributed digitally, think about how it will look on a screen.
If your report is going to be printed on an office printer, try to stay away from using light text against a dark background — it uses a lot of ink, which can bleed and make the text difficult to read. If the report is going to be printed professionally, check in with whoever you’re printing with, and make sure to adhere to their formatting guidelines.
Branding
Make sure your report is consistent with your organization’s colors, fonts, and logo. If your organization has a visual brand strategy, use that!
If you don’t have brand fonts, keep in mind the tone you want to go for. In an annual report, it’s usually better to stick to a more conservative font rather than anything too casual or “out-there.” Above all, make sure the body text is in a font that’s easy to read.
If you don’t have brand colors, choose a few accent colors and stick with them throughout the document. Any colors used in your logo are a good starting point. Be especially careful with text — if there’s not enough contrast between text and its background, it becomes difficult to read. This means you’ll want dark text against a light background, or vice versa. Stay away from layering brightly colored text with a brightly colored background.
Charts, graphs, and infographics
When possible, use charts and graphs to help visualize your financial information, metrics, and how your organization has changed over time. Numbers in tables tend to be harder for people to intuitively understand.
Line graphs are especially effective for communicating how revenue or other financial data has changed year-to-year, and pie or donut charts are useful for breaking down how resources were used. (See Figure 9.)
In addition to graphs, it can help to choose a few key numbers that emphasize your message or help summarize how you did during the last year, and call attention to them by using a contrasting font, size, color, and/or accompanying graphics. (See Figures 10 and 11.)
Photographs
More than just for catching the eye, photographs allow you to illustrate what you do, and give the reader a sense of the culture of your organization.
Photographs are especially effective when accompanying success stories and testimonials — it truly puts a face on the work you do. Photographs are also very useful for illustrating your services, events, and milestones, along with breaking up text and defining sections. (See Figure 12.)
When possible, try to use your own photographs or art instead of stock imagery. Your organization’s own photos will always end up feeling more personal and genuine than photos from a stock site, even if they’re less polished than photos you can find online. Just make sure you have permission to use any artwork or photographs taken of people.
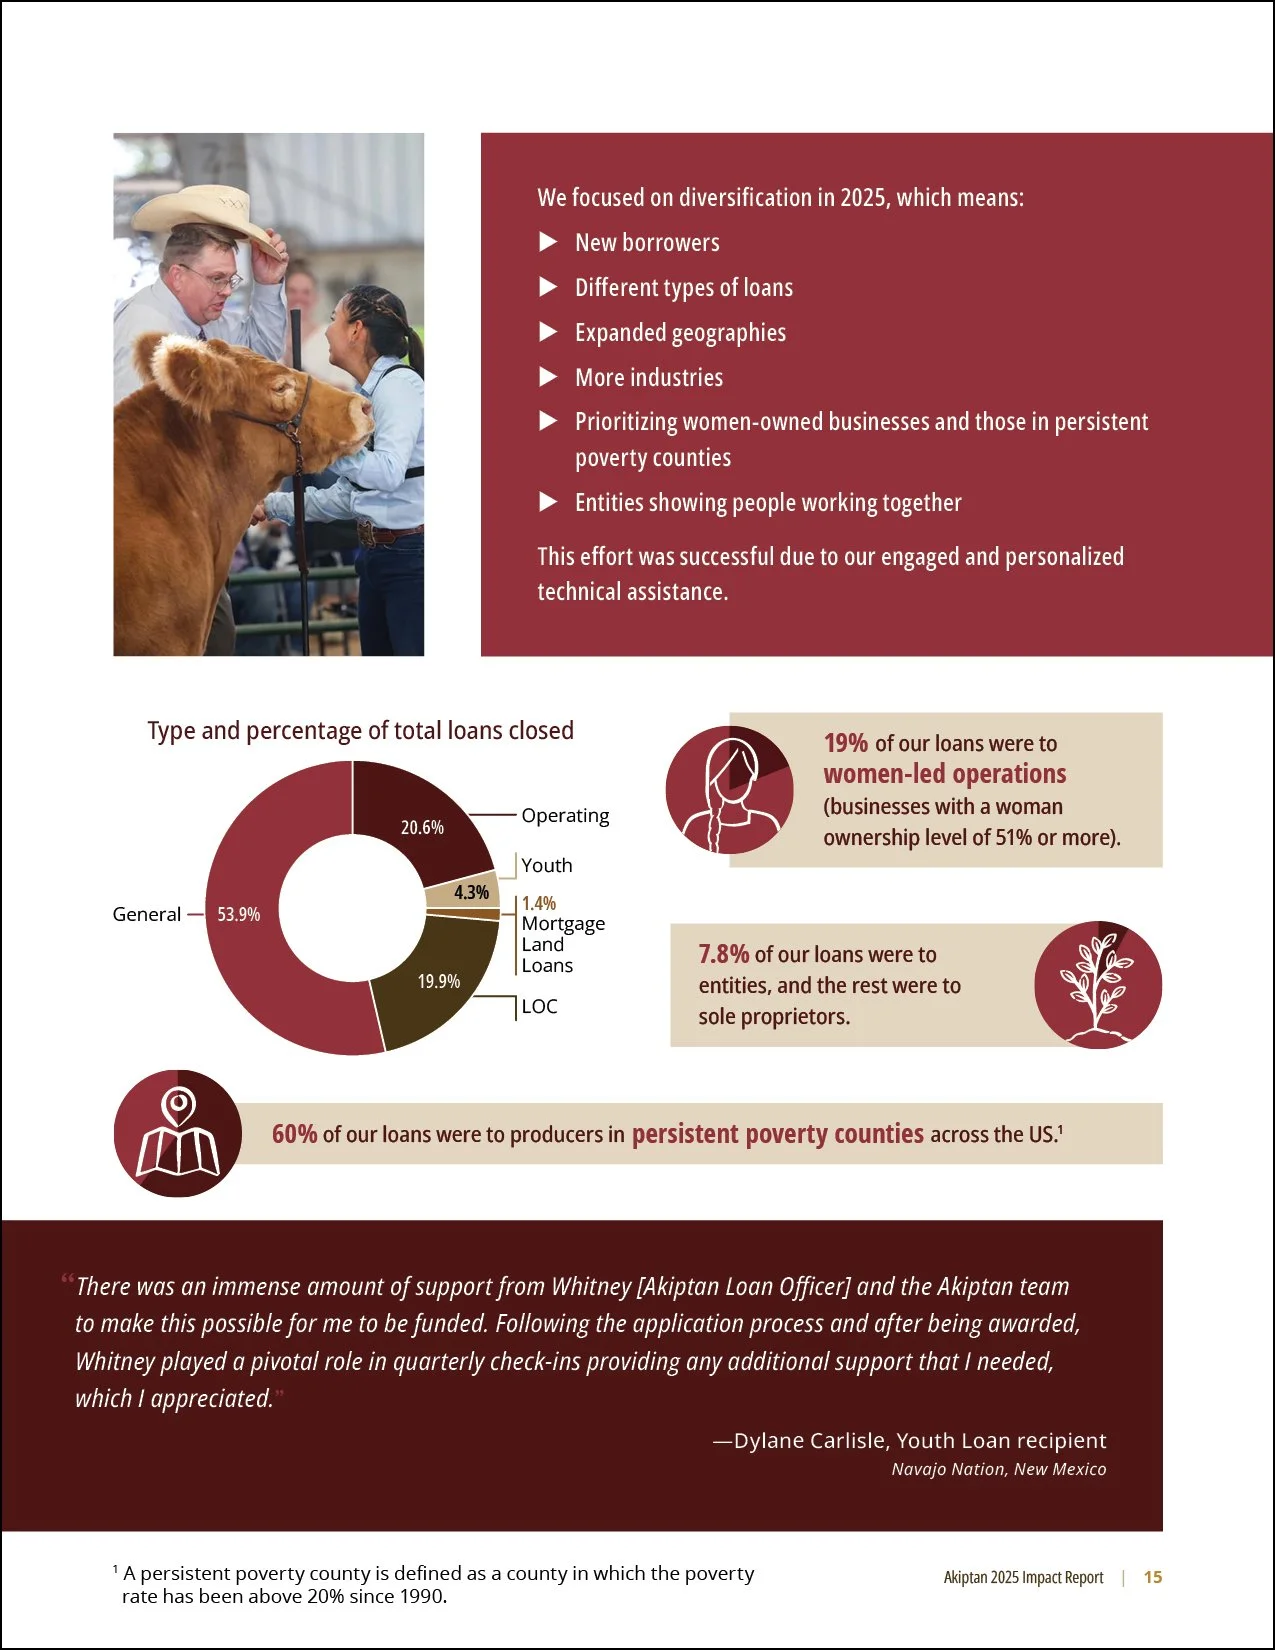
Figure 9
Charts and graphs
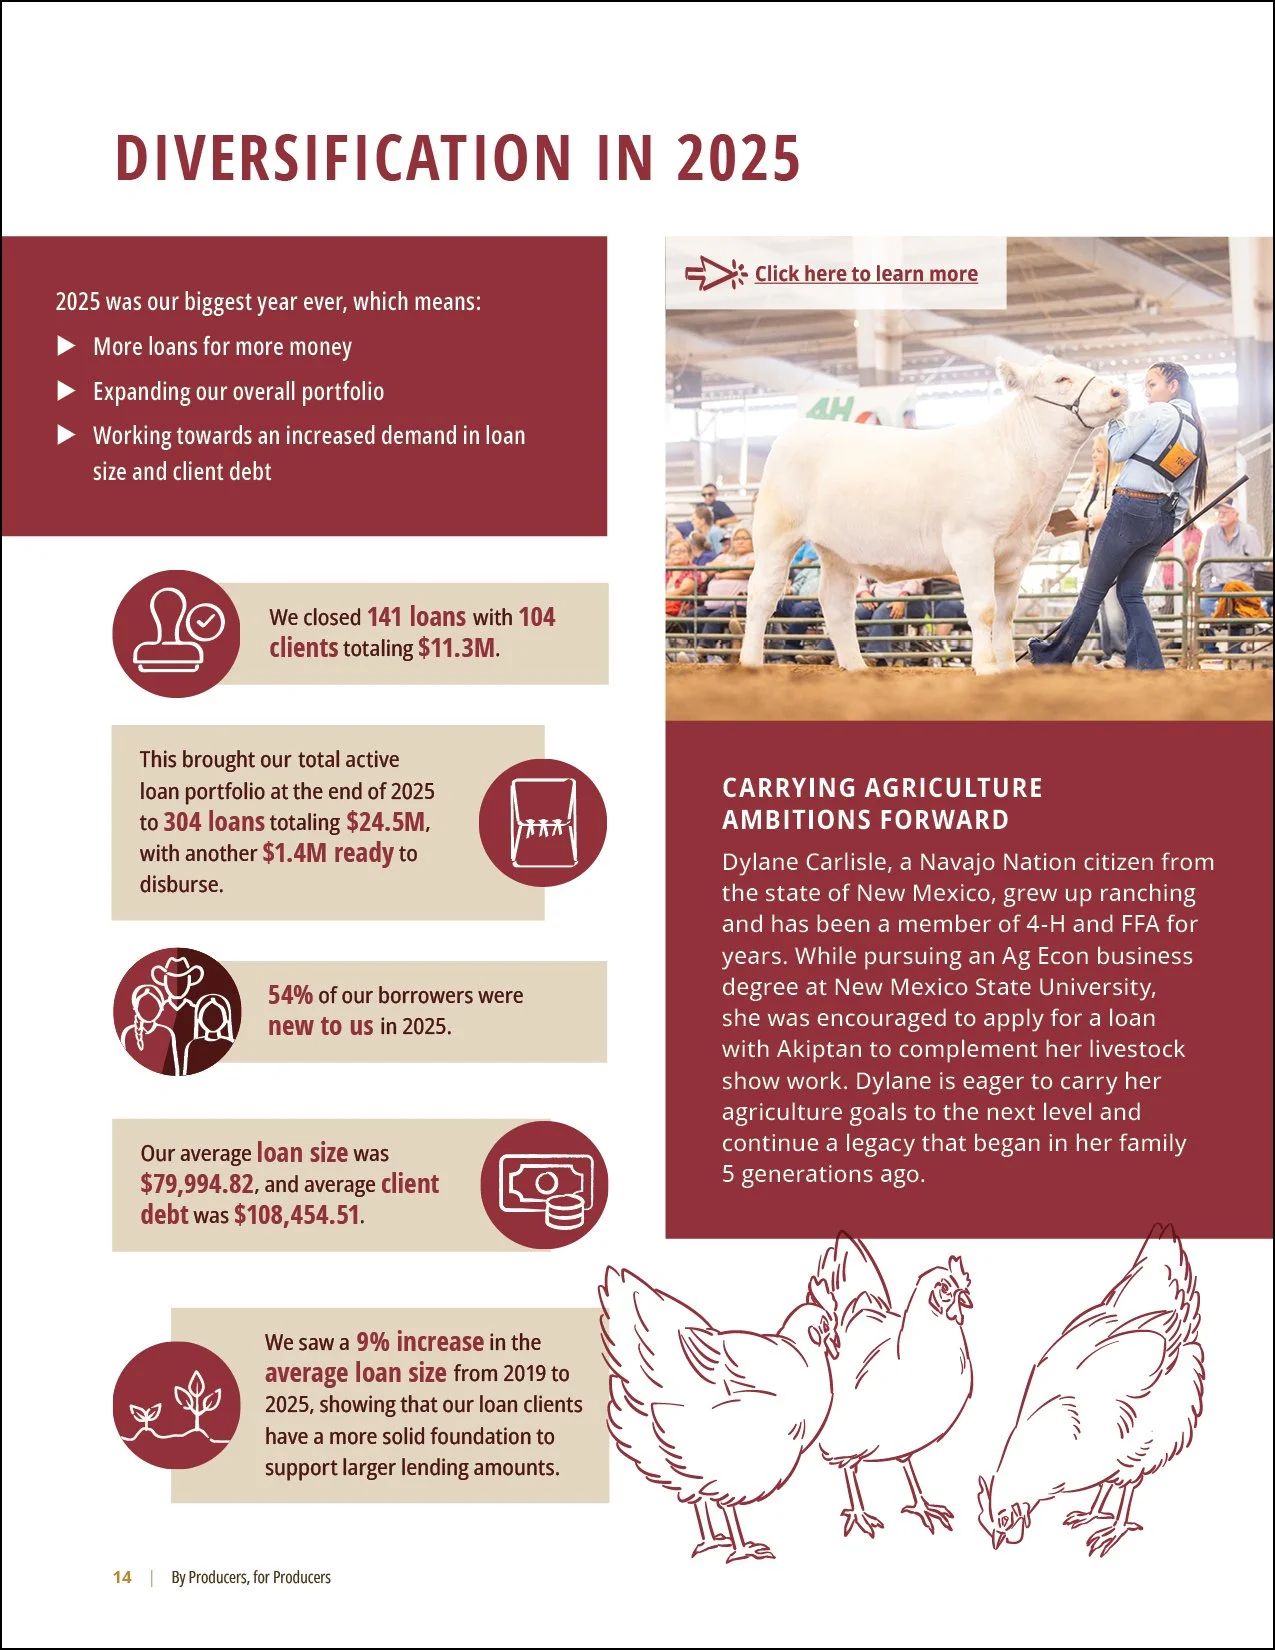
Figure 10
Key information
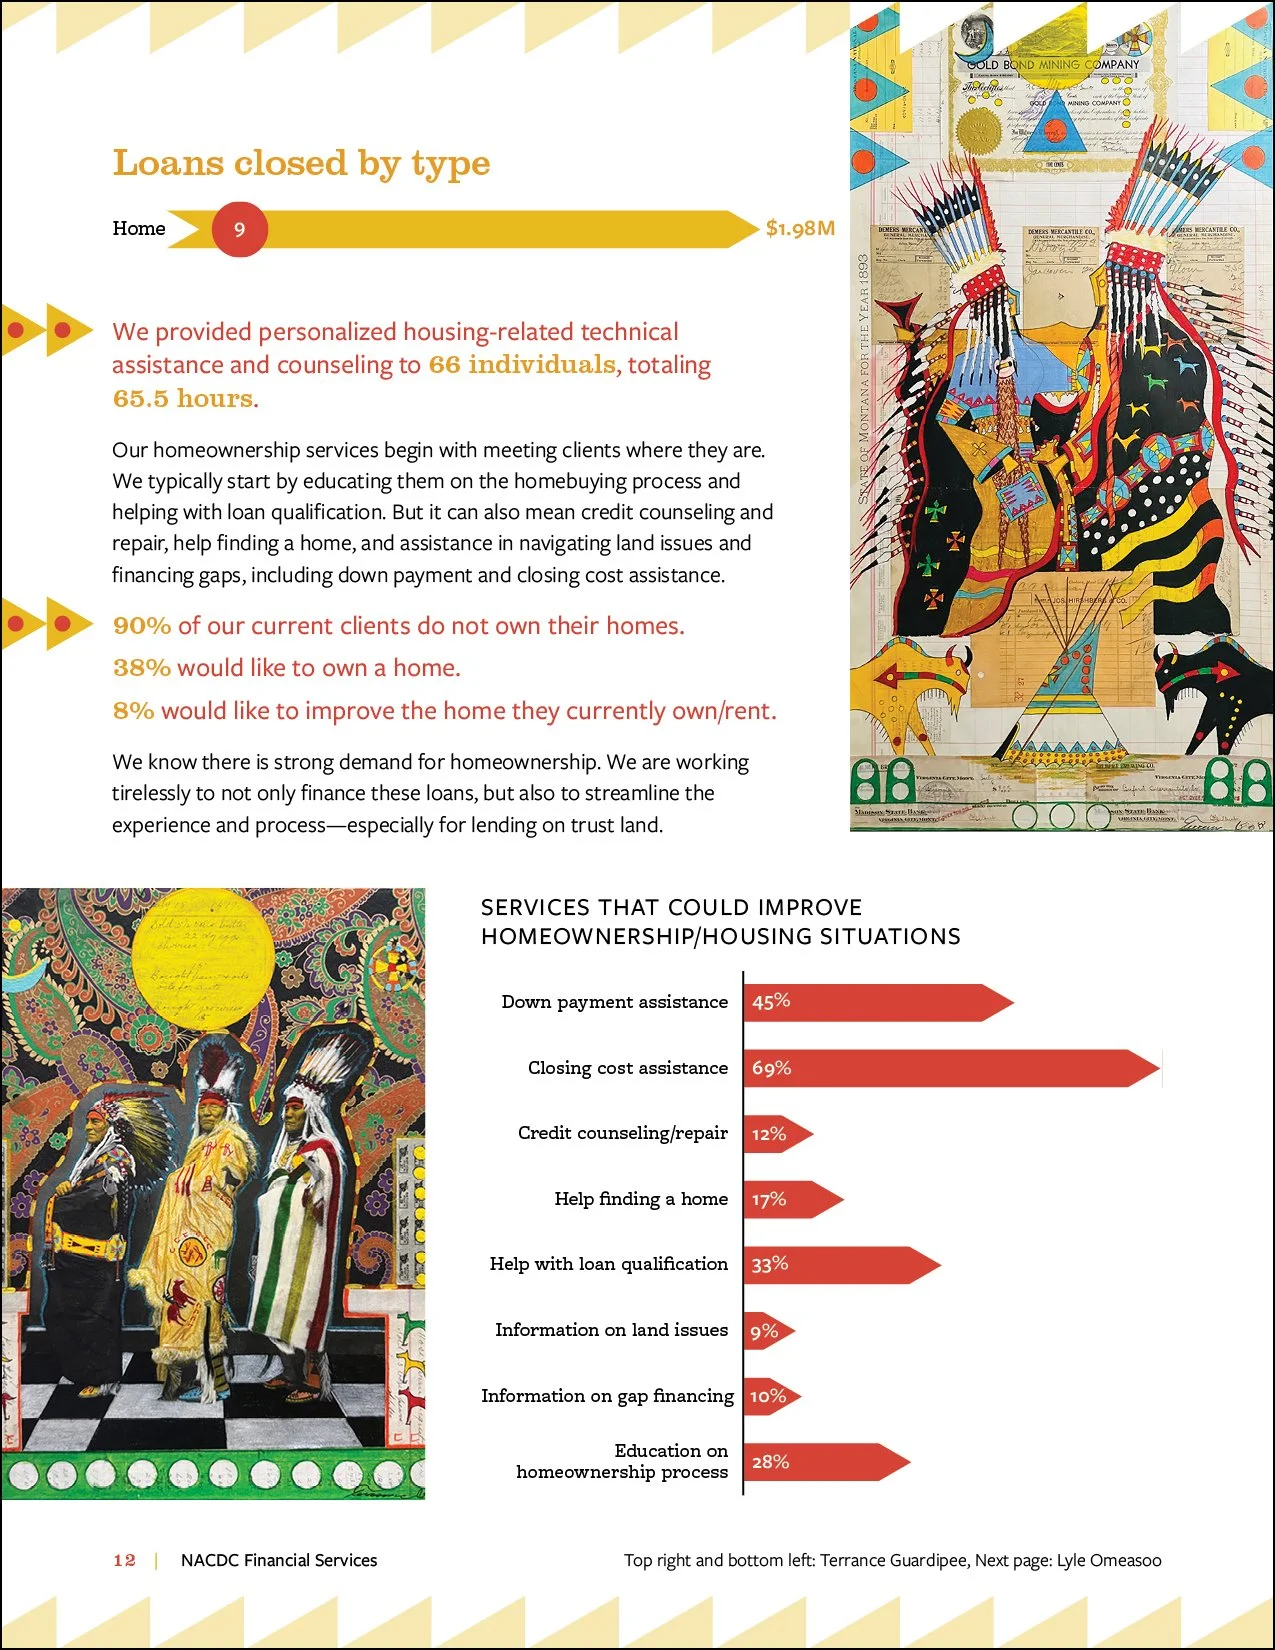
Figure 11
Data emphasis
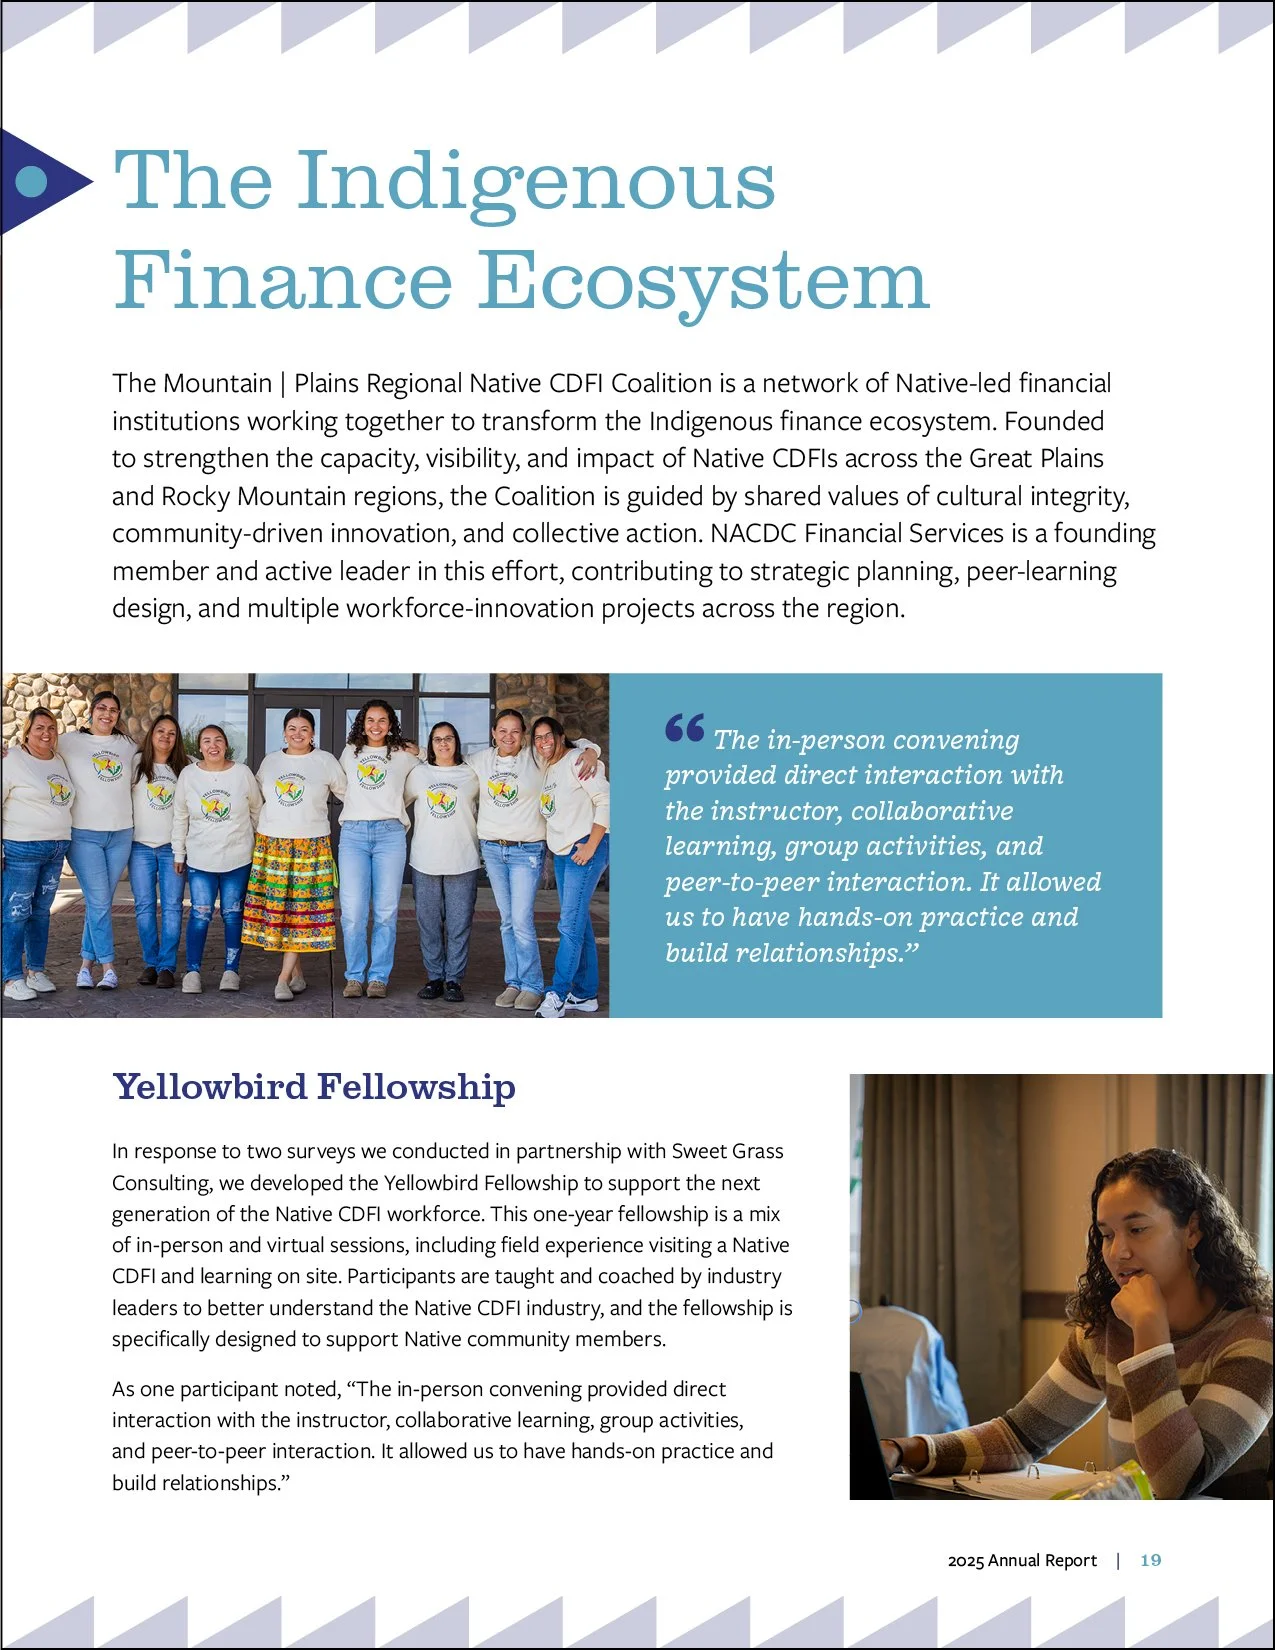
Figure 12
Photographs
Final tips
Start early
Start planning your report before the end of the fiscal year. Identify what information and imagery you’ll need, and compile as much as possible as the year goes on rather than waiting until after it’s over. Reports often take longer than you expect, and ideally you’ll want to publish it relatively soon after your reporting period ends (a 2026 report only does so much if it comes out in December 2027!).
It’s especially helpful to collect good photographs, testimonials, and narratives as you get them; that way, you’re not scrambling to find things when it’s time to create the report.
Keep it concise
Longer isn’t always better. For the most part, people want the important details — how you used your budget, the number of people you helped and how, a few concrete examples of the difference you made. The more text people need to wade through to get to those points, the less likely they’ll be to read the whole thing.
Share